29Oct

Understand How AXIS Bank's Stock is Positioned with Projections Indicating Potential Moves Based on Elliott Wave Theory

AXIS BANK LTD – AXISBANK Elliott Wave Analysis (1D Chart)

AXISBANK Elliott Wave Technical Analysis

Function: Counter Trend (Minor degree, Grey. Wave A unfolding)

Mode: Corrective

Structure: Potential Impulse

Position: Minute Wave ((ii)) Navy of 1/A complete.

Details: Minute Wave ((iii)) Navy appears to be moving towards the 1000 level, as long as resistance around 1345 holds. A minor pullback is currently unfolding, signaling that bearish momentum may soon resume.

Invalidation point: 1340-50.

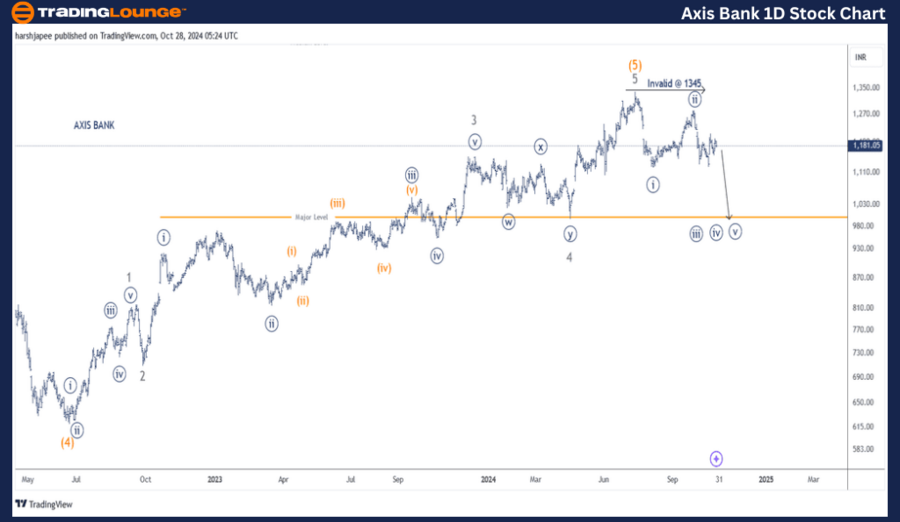
AXIS Bank Daily Chart Analysis: Elliott Wave Counts and Projections

The daily chart for AXIS Bank suggests a completed rally around 1345, marking the termination of Intermediate Wave (5) in Orange. Following this high, the stock appears to be trending lower as Minute Waves ((i)) and ((ii)) seem complete, with Minute Wave ((iii)) in progress, aiming toward the 1000 mark.

Earlier, Intermediate Wave (4) Orange ended around the 620 level in January 2022. From there, Minor Waves 1 through 5 advanced, reaching a peak at 1345. Minor Wave 3 extended near 1155, followed by Minor Wave 4, which ended around 995 in a combination pattern.

A countertrend move at the Minute degree may be developing against the 1345 high, with Minute Wave ((iii)) potentially unfolding at present.

Axis-Bank-Ltd-1D-Sto...


AXIS BANK LTD – AXISBANK Elliott Wave Analysis (4H Chart)

Function: Counter Trend (Minor degree, Grey. Wave A unfolding)

Mode: Corrective

Structure: Potential Impulse

Position: Minute Wave ((ii)) Navy of 1/A complete.

Details: The 4H chart signals that Minute Wave ((iii)) Navy is moving toward 1000, with resistance near the 1345 level. A minor pullback could occur before the next bearish leg resumes.

Invalidation point: 1340-50.

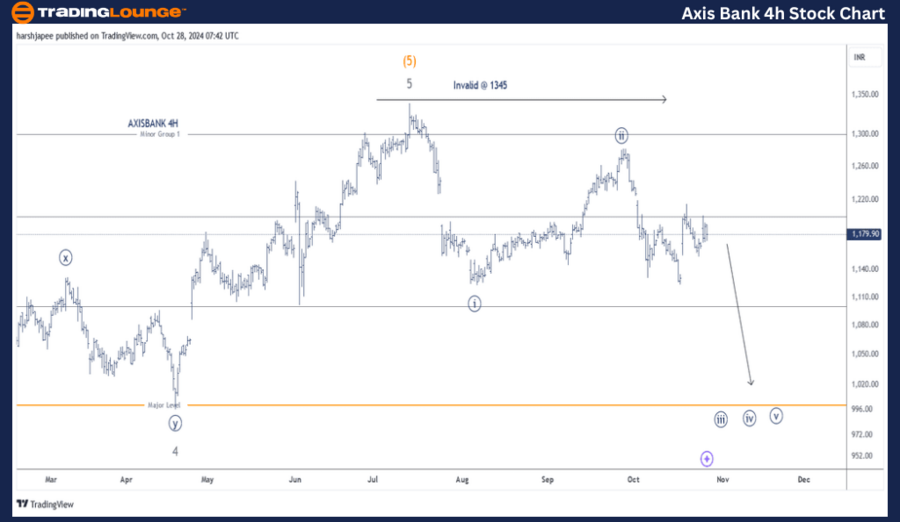
AXIS Bank 4H Chart Analysis: Elliott Wave Insights

The 4H chart for AXIS Bank underscores developments from Minor Wave 3 in Grey onward. Wave 4 appeared as a combination pattern, while Wave 5 surged up to the 1345 high. The lower degree impulse, Minute Wave ((i)), seems to have completed near the 1128 low, followed by a corrective rise in Minute Wave ((ii)) around the 1290 level. Current indications suggest bears are likely to maintain control as Minute Wave ((iii)) progresses.

Technical Analyst: Harsh Japee

Source: visit Tradinglounge.com and learn From the Experts Join TradingLounge Here 

Previous: ADANI Green Energy Elliott Wave Technical Analysis

VALUE Offer - Buy 1 Month & Get 3 Months!Click here

Access 7 Analysts Over 200 Markets Covered. Chat Room With Support

Axis-Bank-Ltd-4h-Sto...


Conclusion

AXIS Bank’s Minute Wave ((iii)) appears poised to trend lower towards the 1000 level, provided prices stay beneath the resistance near 1345.

Related

Dogecoin Elliott Wave Analysis: DOGE Price Prediction, Wave Count, Support & Resistance Levels for Crypto Investors

Dogecoin Elliott Wave Analysis: DOGE Price Prediction, Wave Count, Support & Resistance Levels for Crypto Investors

Dogecoin Elliott Wave analysis, helping traders understand the DOGEUSD market structure. Learn about...

Read More >
Unlocking Market Potential: U.S.Dollar/Japanese Yen (USDJPY) Elliott Wave Analysis - Feb 12, 2024

Unlocking Market Potential: U.S.Dollar/Japanese Yen (USDJPY) Elliott Wave Analysis - Feb 12, 2024

Gain valuable insights into the USDJPY currency pair with comprehensive Elliott Wave analyses conduc...

Read More >
Bitcoin Crypto Price News Today BTCUSD Elliott Wave Technical Analysis: Focusing on BTCUSD Price Movements

Bitcoin Crypto Price News Today BTCUSD Elliott Wave Technical Analysis: Focusing on BTCUSD Price Movements

This article provides an in-depth Bitcoin Elliott Wave analysis, focusing on BTCUSD price movements....

Read More >
CAC 40 Elliott Wave Forecast Shows Bullish Trend and Trading Opportunities in France Stock Market on Daily and Weekly Charts

CAC 40 Elliott Wave Forecast Shows Bullish Trend and Trading Opportunities in France Stock Market on Daily and Weekly Charts

Explore bullish Elliott Wave setups on the CAC 40 with actionable insights on trend direction, wave ...

Read More >
RUSSELL 2000 Index Elliott Wave Technical Analysis: Best Stocks to buy and Market Forecasts

RUSSELL 2000 Index Elliott Wave Technical Analysis: Best Stocks to buy and Market Forecasts

This article offers an in-depth Elliott Wave analysis of the Russell 2000, providing valuable insigh...

Read More >

Buy 1 Month

Get 3 Months!

Special Offer:

Trade Recommendations

Unleash the power of deversified trading with our comprehensive portfolio, covering:

  • Stock Trades
  • Crypto Trades
  • Forex Trades
  • Commodity Trades
Elliott Wave Analysis

Gain a competive edge with expert insights in to:

  • Global Indices
  • US Stocks & ASX Stocks
  • Forex & Crypto
  • Commodities
Top-Notch Trading Tools

Equip yourself with the tools of success:

  • Social Chat
  • Elliott Wave Algorithm
  • Screener
  • TradingLevels
  • Trading Game
7 Elliott Wave Analysts

Stay ahead of the market with daily charts and insightful videos
-Your secret to strategic trading!

JOIN HERE


Welcome to TradingLounge (ASIC A.R.No. 321187), specialists in trades, trading education and technical analysis, covering stocks, indices, commodities, forex and cryptocurrencies.

When you join TradingLounge you have access to everything we offer, including trade tools, educational content and a social platform to chat with like-minded investors.

Read more

@Copyright 2024 by tradinglounge.com

Contact Us

Australian no: 02 4787 6020

International no: +61 (2) 47876020

Pay with:

Find us on