EURGBP Elliott Wave Analysis – Trading Lounge Day Chart
Euro/British Pound (EURGBP) Day Chart Analysis
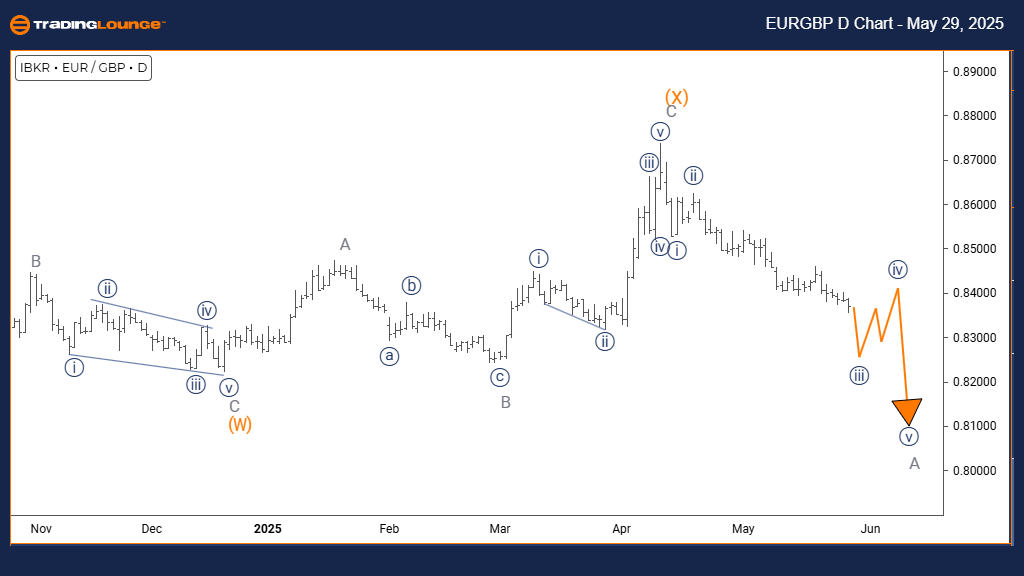
EURGBP Elliott Wave Technical Forecast
Function: Counter-Trend Move
Wave Mode: Impulsive Pattern
Wave Structure: Navy Blue Wave 3 Formation
Current Position: Gray Wave A Development
Next Higher Degree: Navy Blue Wave 4 Projection
Key Insight: Completion of Navy Blue Wave 2 signals active progression of Wave 3
EURGBP Technical Overview
The EURGBP daily timeframe highlights a counter-trend environment with impulsive characteristics nested within a larger corrective pattern. The chart confirms the end of Navy Blue Wave 2 and the activation of Navy Blue Wave 3 within the emerging Gray Wave A structure. This transition marks the start of a short-term bearish impulse wave in the broader corrective cycle.
Market Behavior
Following the finalization of Navy Blue Wave 2, EURGBP is now progressing into Navy Blue Wave 3, characterized by increased bearish momentum. Despite the current downside activity, the structure fits within an ongoing correction rather than a long-term bearish reversal. This wave position provides clarity on EURGBP’s mid-cycle correction and reinforces its status in a complex wave setup.
Trading Implications
Traders can expect additional downside movement as Wave 3 extends. Upon Wave 3’s completion, a temporary recovery via Wave 4 may occur. Although the trend is currently downward, it remains corrective, not impulsively bearish in the macro trend. Careful monitoring of this phase is essential for identifying optimal entry and exit points using Elliott Wave principles and risk management strategies.
This updated wave analysis helps traders understand EURGBP’s current price dynamics within its corrective framework, supporting strategic decisions for short-term bearish trades.
EURGBP Elliott Wave Analysis – Trading Lounge 4-Hour Chart
Euro/British Pound (EURGBP) 4-Hour Chart Analysis
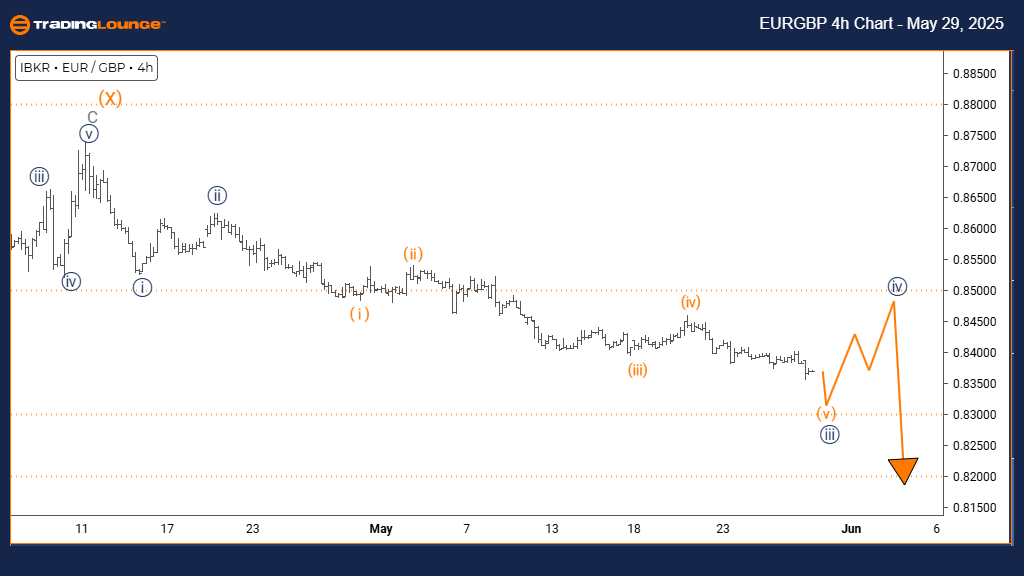
EURGBP Short-Term Elliott Wave Technical Forecast
Function: Active Bearish Trend
Wave Mode: Impulsive Leg
Wave Structure: Orange Wave 5 in Development
Current Position: Within Navy Blue Wave 3
Next Higher Degree: Navy Blue Wave 4 Correction Expected
Key Insight: Orange Wave 4 is likely complete; Orange Wave 5 downward move has started
Technical Overview
The 4-hour EURGBP chart reveals a well-defined bearish trend with the formation of Orange Wave 5 signaling ongoing selling pressure. This movement unfolds within the broader Navy Blue Wave 3 leg, confirming that Orange Wave 4 has likely ended. The current setup supports a continuation of the impulsive downtrend in the final stretch of this Elliott Wave phase.
Market Behavior
With Orange Wave 4 completed, the development of Orange Wave 5 suggests strong downside continuation. This phase remains part of Navy Blue Wave 3, indicating the pair’s bearish sentiment persists. The structure provides traders with insights into how far the current trend may extend before correction or exhaustion occurs.
Trading Implications
This wave count implies that EURGBP may be in its final downward push before a larger correction begins. Traders should remain alert for key fifth-wave signs such as weakening momentum or divergence. These indicators often suggest trend completion zones and are vital for validating future market direction.
Although the setup supports short-term selling, traders must remain vigilant for potential trend reversal cues. This Elliott Wave projection offers a precise technical context, assisting in risk-adjusted decision-making as the current bearish trend reaches a probable conclusion.
Technical Analyst: Malik Awais
Source: Visit Tradinglounge.com and learn from the Experts. Join TradingLounge Here
Previous: AUDJPY Elliott Wave Technical Analysis
VALUE Offer - Buy 1 Month & Get 3 Months!Click here
Access 7 Analysts Over 200 Markets Covered. Chat Room With Support