AUDJPY Elliott Wave Analysis – Trading Lounge Daily Chart
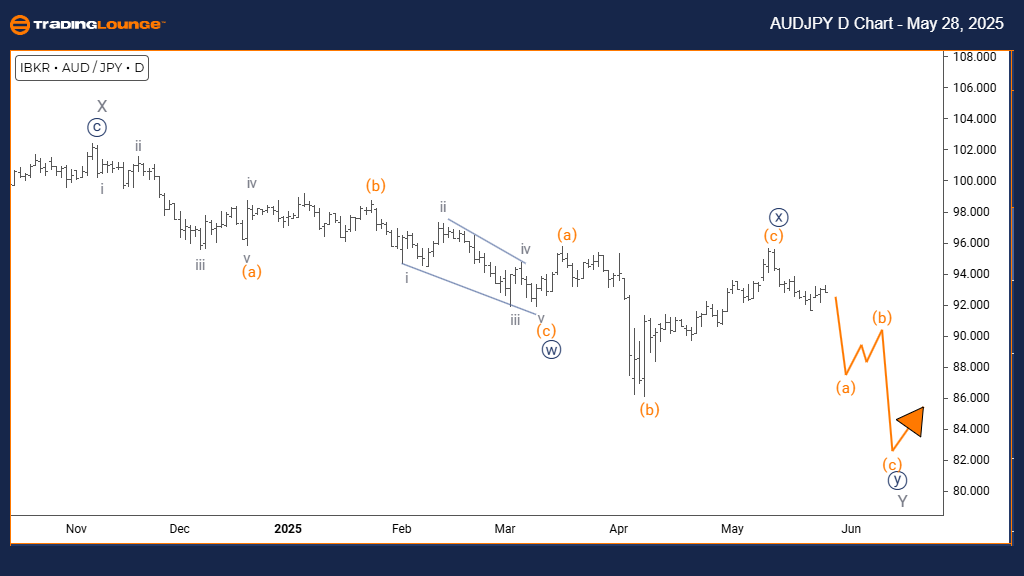
Australian Dollar / Japanese Yen (AUDJPY) – Daily Chart
AUDJPY Elliott Wave Technical Overview
Function: Counter Trend
Mode: Corrective
Structure: Navy Blue Wave Y
Position: Gray Wave Y
Direction (Next Lower Degrees): Navy Blue Wave Y (initiated)
Details: The completion of navy blue wave X confirms the initiation of navy blue wave Y in the ongoing corrective phase.
AUDJPY Daily Elliott Wave Analysis
The daily Elliott Wave analysis for the AUDJPY currency pair identifies an active corrective counter-trend movement. This current structure is part of a larger, complex formation, unfolding as navy blue wave Y within gray wave Y. Following the completion of navy blue wave X, the chart now reflects the development of wave Y, indicating the final stages of a broader market correction.
This phase typically suggests that the corrective sequence is approaching its conclusion, potentially paving the way for a return to the dominant market trend. The chart shows overlapping wave formations and limited momentum, signaling a corrective nature rather than an impulsive trend. Traders should recognize these conditions as typical for corrections, offering insight into the market's current state within the cycle.
Market volatility may persist as AUDJPY navigates through the final wave Y. Investors should closely monitor price action for potential reversal signs or confirmation that wave Y has ended. The daily chart reinforces that the market remains within a corrective structure, advising caution and the use of sound risk management practices.
This analysis offers strategic value for identifying probable trend reversal points and understanding where the market stands in the broader corrective wave. Once this phase concludes, the prevailing trend is likely to resume, making it essential for traders to remain alert.
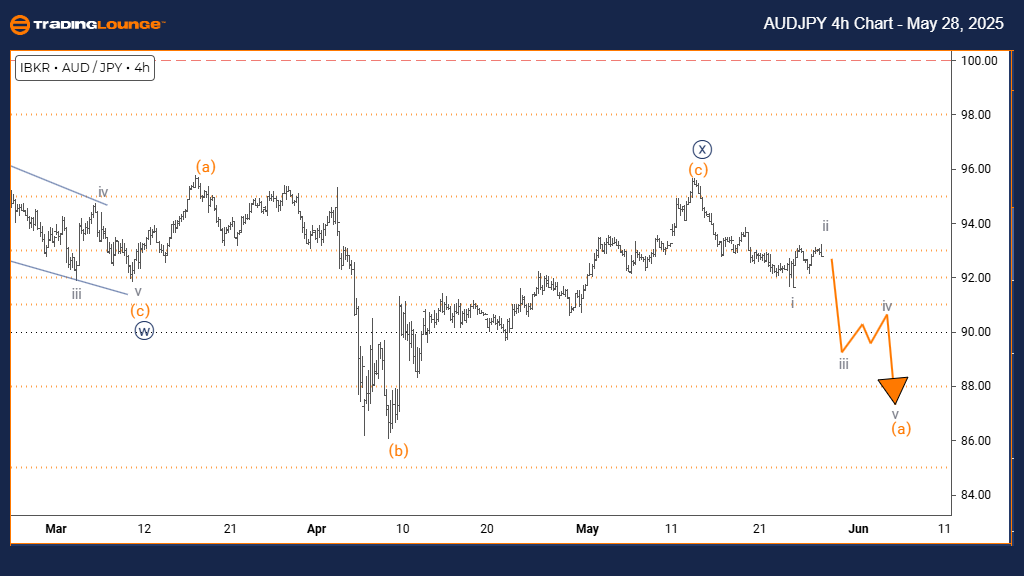
Australian Dollar / Japanese Yen (AUDJPY) – 4-Hour Chart
AUDJPY Elliott Wave Technical Overview
Function: Counter Trend
Mode: Impulsive
Structure: Orange Wave A
Position: Navy Blue Wave Y
Direction (Next Lower Degrees): Orange Wave A (initiated)
Details: The end of navy blue wave X signals the beginning of orange wave A of Y, indicating a bearish impulsive move.
AUDJPY 4-Hour Elliott Wave Forecast
The 4-hour Elliott Wave setup for AUDJPY reflects a bearish impulse forming within a broader correction. Orange wave A has emerged as part of navy blue wave Y, following the finalization of wave X. This pattern indicates the market's current decline is the first leg of a potentially extended corrective process.
This impulsive wave is marked by sharp downward movement and strong selling pressure. The positioning of this leg within navy blue wave Y confirms that it is still part of a larger correction and not the start of a new bearish trend. For traders, this distinction is crucial when determining strategy and market outlook.
Expect continued downward momentum as orange wave A develops. However, since this movement is contained within a correction, it's important to anticipate the possibility of wave B initiating a temporary reversal or retracement. Identifying this transition could help in making well-timed trades.
Understanding the Elliott Wave structure on this chart provides a practical perspective on managing both short-term bearish activity and potential bullish retracements. As this is only a part of a more complex correction, further wave formations are expected before the pattern completes.
Technical Analyst: Malik Awais
Source: Visit Tradinglounge.com and learn from the Experts. Join TradingLounge Here
Previous: U.S. Dollar / Canadian Dollar (USDCAD) Elliott Wave Technical Analysis
VALUE Offer - Buy 1 Month & Get 3 Months!Click here
Access 7 Analysts Over 200 Markets Covered. Chat Room With Support