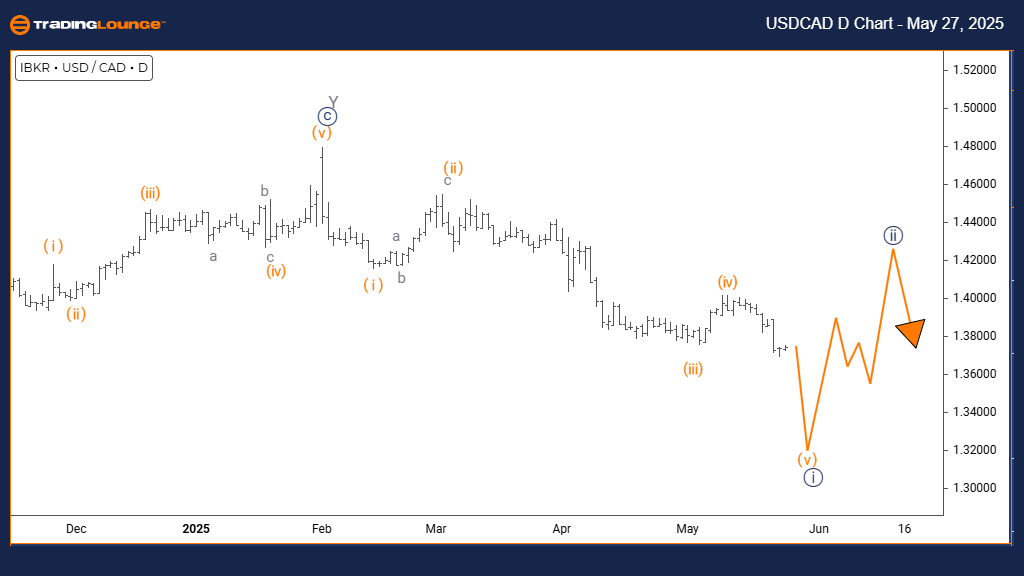
USDCAD Elliott Wave Analysis – Trading Lounge Day Chart
U.S. Dollar / Canadian Dollar (USDCAD) Day Chart Analysis
USDCAD Elliott Wave Technical Analysis
FUNCTION: Bearish Trend
MODE: Impulsive
STRUCTURE: Navy Blue Wave 1
POSITION: Gray Wave 1
DIRECTION NEXT LOWER DEGREES: Navy Blue Wave 2
DETAILS: Navy blue wave 1 is evolving as a key part of gray wave 1, initiating a fresh bearish sequence.
Market Overview
The USDCAD daily chart displays a firm bearish outlook. Current Elliott Wave analysis reveals that this could be the early phase of a more extensive downward trend. Navy blue wave 1 is actively forming within gray wave 1, confirming the start of a new impulsive move lower. So far, no reversal signals are present, supporting a continued bearish direction.
Wave Structure Details
Navy blue wave 1 is progressing as a component of gray wave 1. This impulsive wave indicates strong selling momentum and the potential beginning of a broader downtrend. Daily chart analysis implies this bearish move could extend further before a meaningful correction sets in. The current decline is not a minor retracement but may signal the onset of a prolonged down phase.
Trading Context
This Elliott Wave structure outlines a bearish cycle in progress. Gray wave 1 is unfolding through navy blue wave 1, indicating early-stage selling pressure. As this pattern matures, traders should anticipate the eventual formation of navy blue wave 2, which would serve as a corrective phase following the first impulsive wave.
Trader Guidance
Focus on price action that supports the impulsive wave's momentum. Look for high volume and increasing bearish pressure—common traits of a developing trend. This USDCAD Elliott Wave forecast suggests additional downside potential. However, traders should also prepare for the inevitable pullback as the wave structure progresses. The daily chart reinforces the current trend’s strength and its possible duration.
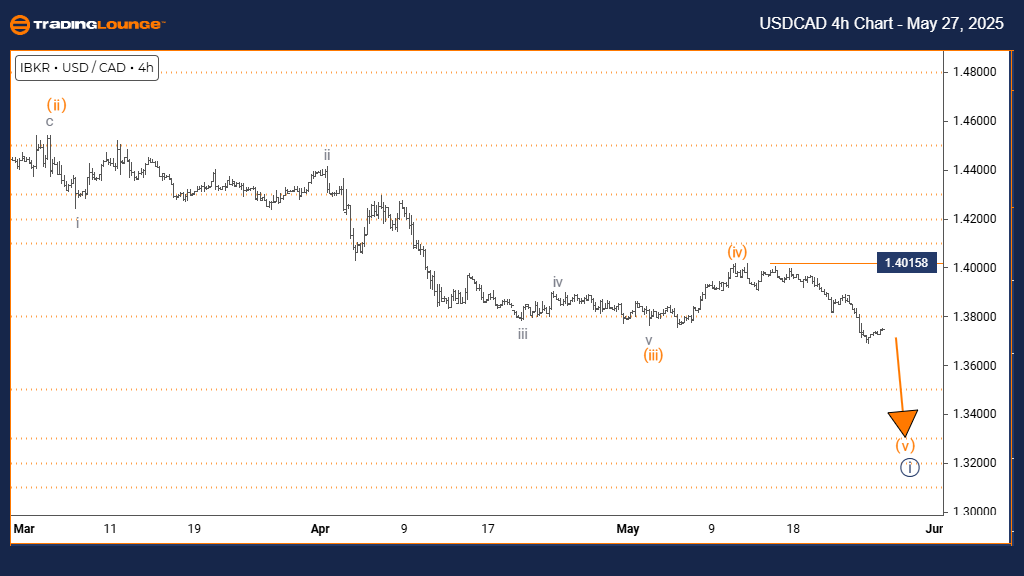
U.S. Dollar / Canadian Dollar (USDCAD) 4-Hour Chart
USDCAD Elliott Wave Technical Analysis
FUNCTION: Bearish Trend
MODE: Impulsive
STRUCTURE: Orange Wave 5
POSITION: Navy Blue Wave 1
DIRECTION NEXT LOWER DEGREES: Orange Wave 5 (ongoing)
DETAILS: Completion of orange wave 4 appears likely, with orange wave 5 actively unfolding.
Wave Cancel Invalid Level: 1.40158
Market Overview
The 4-hour USDCAD chart highlights a sustained bearish structure. According to Elliott Wave principles, orange wave 5 is forming within navy blue wave 1, signaling continued downward momentum after the apparent end of orange wave 4. This wave typically marks the final phase of an impulsive trend, often followed by trend exhaustion or reversal signals.
Wave Development
The analysis confirms orange wave 4 is complete, and orange wave 5 is in motion. This final leg within navy blue wave 1 suggests ongoing selling interest. The structure hints at either a deeper drop or emerging signs of market fatigue as the wave nears completion.
Trading Strategy Insights
Traders can leverage this structure to identify shorting opportunities. Orange wave 5 often leads to the last sharp decline within a cycle. Price monitoring is key—watch for waning momentum or divergence, which often precede wave completions and potential reversals.
Risk Management and Watch Points
This Elliott Wave analysis provides actionable insight into market direction and potential turning points. Although the overall bearish trend remains intact, traders must stay alert for clues of wave completion. These signs can indicate a transition to a new phase or trend. Use this USDCAD Elliott Wave forecast to plan effective risk management as the current cycle nears its conclusion.
Technical Analyst: Malik Awais
Source: Visit Tradinglounge.com and learn from the Experts. Join TradingLounge Here
Previous: British Pound/ U.S. Dollar (GBPUSD) Elliott Wave Technical Analysis
VALUE Offer - Buy 1 Month & Get 3 Months!Click here
Access 7 Analysts Over 200 Markets Covered. Chat Room With Support