ASX: V300AEQ ETF UNITS – VAS Elliott Wave Analysis TradingLounge (1D Chart)

Greetings, our updated Elliott Wave analysis focuses on the Australian Stock Exchange (ASX) with V300AEQ ETF UNITS – VAS. VAS has completed wave 2-grey, and wave 3-grey is currently unfolding, which could drive higher prices.

VAS Elliott Wave Technical Analysis

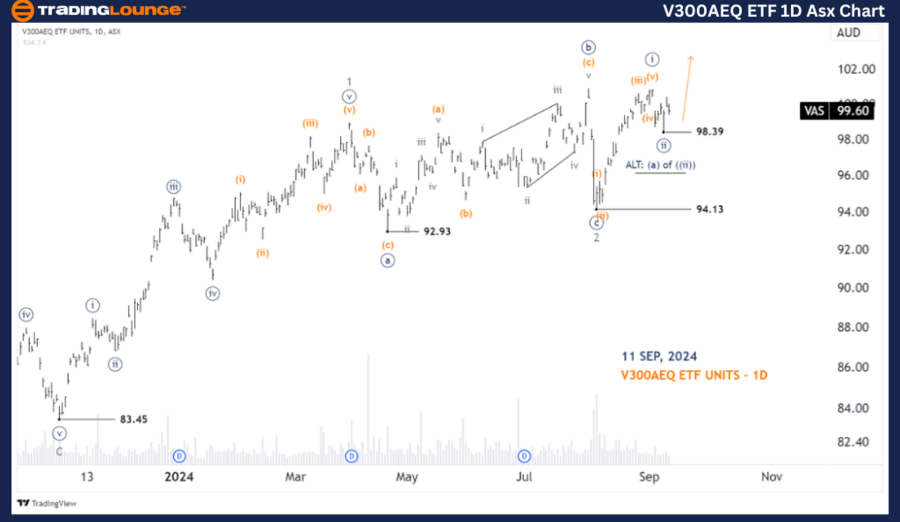
ASX: V300AEQ ETF UNITS – VAS 1D Chart (Semilog Scale) Analysis

Function: Major trend (Minor degree, grey)

Mode: Motive

Structure: Impulse

Position: Wave ((iii))-navy of Wave 3-grey

Details: Wave 2-grey concluded at the 94.13 low, forming an Expanded Flat. Now, wave 3-grey is in progress, subdividing as it unfolds. Wave ((i)) and ((ii))-navy are complete, and wave ((iii))-navy is likely unfolding to push prices higher. The dip below 98.39 indicates that wave ((ii))-navy extended more than initially anticipated, but the overall expectation remains that wave ((iii))-navy will continue pushing upwards.

Invalidation point: 98.39

V300AEQ-ETF-1D-Asx-C...


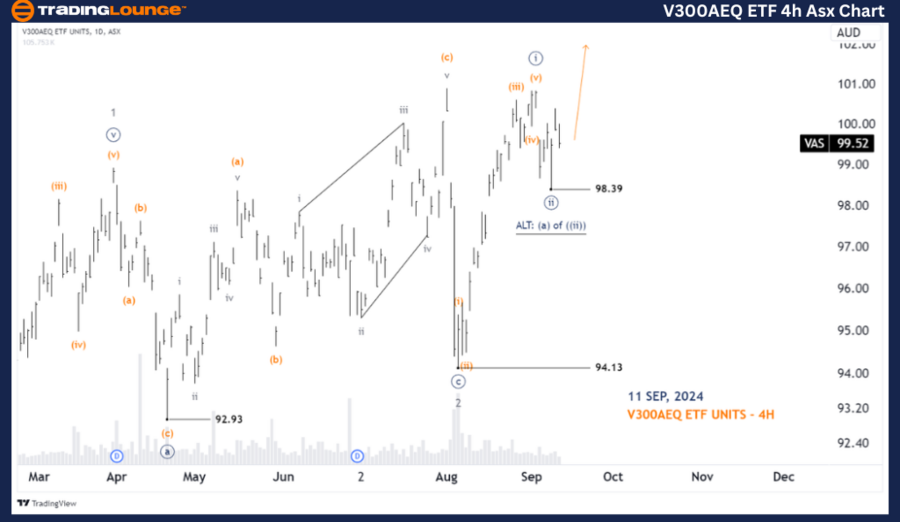
ASX: Vanguard Australian Shares – VAS TradingLounge (4-Hour Chart)

ASX: V300AEQ ETF UNITS – VAS 4-Hour Chart Analysis

Function: Major trend (Minute degree, navy)

Mode: Motive

Structure: Impulse

Position: Wave ((iii))-navy

Details: Wave ((i))-navy completed as a Five-wave sequence, while wave ((ii))-navy appears to have ended as a Zigzag at the 98.39 low. Wave ((iii))-navy is currently developing and should drive prices higher. A break below the 98.39 level suggests that wave ((ii))-navy extended longer than expected. We are now observing trading setups near the 100.00 level for potential opportunities.

Invalidation point: 98.39

Conclusion:

Our Elliott Wave analysis of ASX: V300AEQ ETF UNITS – VAS provides a strategic forecast on current market trends. We highlight key price points for validation or invalidation of our wave count, allowing traders to approach the market with confidence. By considering both short-term setups and longer-term trends, our analysis is designed to help readers capitalize on market movements effectively.

Technical Analyst: Hua (Shane) Cuong, CEWA-M (Master’s Designation).

Source: visit Tradinglounge.com and learn From the Experts Join TradingLounge Here 

See Previous: XERO LIMITED - XRO Elliott Wave Technical Analysis

Special Trial Offer - 0.76 Cents a Day for 3 Months! Click here

Access 7 Analysts Over 200 Markets Covered. Chat Room With Support

V300AEQ-ETF-4h-Asx-C...


Related

Expert Forecasts, Technical Indicators, and Market Insights: Uniswap Crypto Price News Today Elliott Wave Technical Analysis

Expert Forecasts, Technical Indicators, and Market Insights: Uniswap Crypto Price News Today Elliott Wave Technical Analysis

Explore detailed Uniswap (UNIUSD) Elliott Wave analysis with insights into price predictions and mar...

Read More >
Watch CAT Stock Progresses through its Current Market Structure Using Caterpillar Inc. (CAT) Elliott Wave Technical Analysis

Watch CAT Stock Progresses through its Current Market Structure Using Caterpillar Inc. (CAT) Elliott Wave Technical Analysis

This article provides a comprehensive Elliott Wave analysis of Caterpillar Inc. (CAT), examining bot...

Read More >
Texas Instruments (TXN) Elliott Wave Analysis: Stock Forecast, Price Prediction, Bullish Trend, and Trading Strategy for Smart Investors

Texas Instruments (TXN) Elliott Wave Analysis: Stock Forecast, Price Prediction, Bullish Trend, and Trading Strategy for Smart Investors

Texas Instruments (TXN) Elliott Wave analysis with insights into its bullish trend, price forecast, ...

Read More >
Comprehensive Elliott Wave Technical Analysis of Crude Oil WTI: A Guide for Traders

Comprehensive Elliott Wave Technical Analysis of Crude Oil WTI: A Guide for Traders

Elliott Wave analysis indicates a bullish correction trend in Crude Oil WTI. The market is currently...

Read More >
Polkadot Forecast and DOTUSD Elliott Wave Analysis, Confirming Bullish Breakout and Trend Continuation from Fibonacci Zone

Polkadot Forecast and DOTUSD Elliott Wave Analysis, Confirming Bullish Breakout and Trend Continuation from Fibonacci Zone

Polkadot (DOT) is showing bullish momentum, entering wave 3 after a Zigzag correction. Elliott Wave ...

Read More >

$1 for 2 Weeks

then $29 a month!

What a Special Offer!

Trade Recommendations

Unleash the power of deversified trading with our comprehensive portfolio, covering 250+ markets:

  • Stock Trades
  • Crypto Trades
  • Forex Trades
  • Commodity Trades
Elliott Wave Analysis

Gain a competitive edge with expert insights and AI-powered Elliott Wave charting into:

  • Global Indices
  • US Stocks & ASX Stocks
  • Forex & Crypto
  • Commodities
Top-Notch Trading Tools

Equip yourself with the tools of success:

  • Real-time Chat rooms
  • Elliott Wave Algorithm
  • Portfolio tools
  • TradingLevels
  • Screener
  • Trading Game
7 Elliott Wave Analysts

Stay ahead of the market with daily charts and insightful videos
Your secret to strategic trading!

JOIN HERE


Welcome to TradingLounge (ASIC A.R.No. 321187), specialists in trades, trading education and technical analysis, covering stocks, indices, commodities, forex and cryptocurrencies.

When you join TradingLounge you have access to everything we offer, including trade tools, educational content and a social platform to chat with like-minded investors.

Read more

@Copyright 2024 by tradinglounge.com

Contact Us

Australian no: 02 4787 6020

International no: +61 (2) 47876020

Pay with:

Find us on