Welcome to our latest Elliott Wave analysis for NVIDIA Corp. (NVDA) as of August 5, 2024. This analysis provides an in-depth look at NVDA's price movements using the Elliott Wave Theory, helping traders identify potential opportunities based on current trends and market structure. We will cover insights from both the daily and 4-hour charts to offer a comprehensive perspective on NVDA's market behavior.

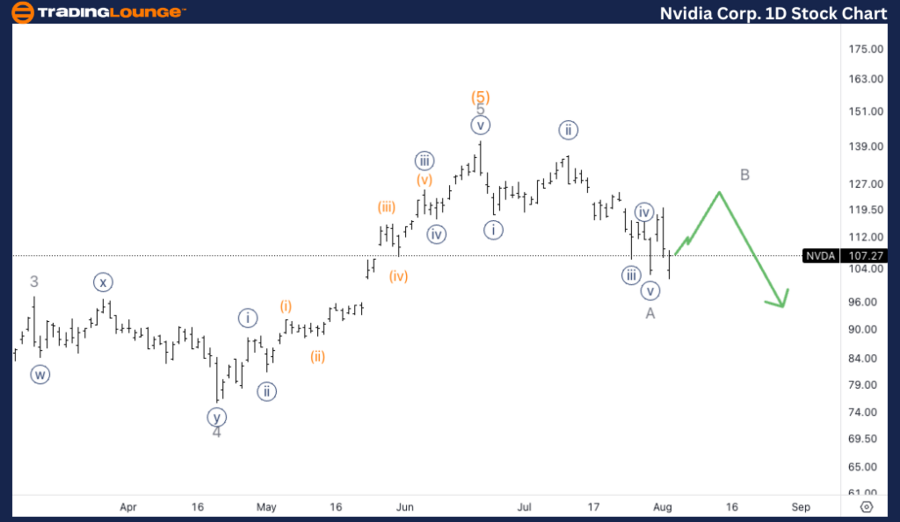
NVDA Elliott Wave Analysis Trading Lounge Daily Chart

NVIDIA Corp. (NVDA) Daily Chart Analysis

NVDA Elliott Wave Technical Analysis

Function: Counter Trend

Mode: Corrective

Structure: Zigzag

Position: Intermediate wave (A)

Direction: Downside within wave (A)

Details: Looking for a top in wave (5), as we seem to have failed to find support on top of MG1 of $100. Looking for a clear break and retest of TL1 at $100 to have additional confidence in further downside developments for the longer term.

NVDA  Technical Analysis – Daily Chart

The analysis indicates that NVIDIA has likely reached a top in wave (5), failing to find support on top of the medium-grade level (MG1) at $100. This failure suggests further downside potential. A clear break and subsequent retest of the trendline (TL1) at $100 would provide additional confidence in the bearish outlook for the longer term.
NVIDIA-Corp-1D-Stock...


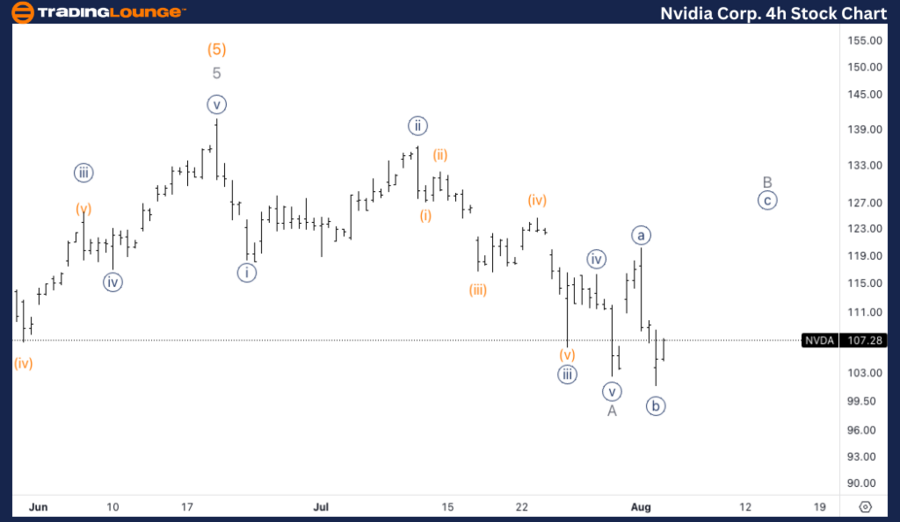
NVDA Elliott Wave Analysis Trading Lounge 4H Chart

NVIDIA Corp. (NVDA) 4H Chart Analysis

NVDA Elliott Wave Technical Analysis

Function: Counter trend

Mode: Corrective

Structure: Zigzag

Position: Minor wave A

Direction: Bounce in wave B

Details: Here we are entertaining the possibility of a bounce in either wave B or 2 to then fall back lower, breaking the $100 barrier.

NVDA Stock Technical Analysis – 4H Chart

The shorter time frame suggests the possibility of a bounce within wave B or wave 2, which could provide a temporary relief rally before the continuation of the downward move. This bounce would precede a further decline, potentially breaking below the $100 barrier as the corrective phase progresses.

Technical Analyst: Alessio Barretta

Source: visit Tradinglounge.com and learn From the Experts Join TradingLounge Here 

See Previous: Visa Inc. (V) Elliott Wave Technical Analysis

Special Trial Offer - 0.76 Cents a Day for 3 Months! Click here

Access 7 Analysts Over 170 Markets Covered. Chat Room With Support
NVIDIA-Corp-4h-Stock...

Related

Key Technical Levels to Watch and Understand the Commodity Market's Outlook for Corn: Corn Elliott Wave Analysis

Key Technical Levels to Watch and Understand the Commodity Market's Outlook for Corn: Corn Elliott Wave Analysis

This analysis provides a detailed overview of Corn’s Elliott Wave structure, focusing on its curren...

Read More >
ASX Trading Success: WISETECH GLOBAL LIMITED – WTC Stock Analysis & Elliott Wave Technical Forecast

ASX Trading Success: WISETECH GLOBAL LIMITED – WTC Stock Analysis & Elliott Wave Technical Forecast

This article provides an up-to-date Elliott Wave analysis of WiseTech Global Limited (WTC) on the Au...

Read More >
Stock Analysis: The Procter & Gamble Company (PG) Elliott Wave Technical Analysis 1 March 24

Stock Analysis: The Procter & Gamble Company (PG) Elliott Wave Technical Analysis 1 March 24

In our PG Elliott Wave Analysis Trading Lounge, we provide comprehensive insights into The Procter &...

Read More >
Discover How to leverage Elliott Wave Theory to make Informed Decisions about McDonald's Corp. Stock: MCD Elliott Wave analysis

Discover How to leverage Elliott Wave Theory to make Informed Decisions about McDonald's Corp. Stock: MCD Elliott Wave analysis

This article provides a detailed Elliott Wave analysis of McDonald's Corp. (MCD), focusing on ke...

Read More >
AAVE / U.S. dollar(AAVEUSD) Elliott Wave Technical Analysis 18 January 24

AAVE / U.S. dollar(AAVEUSD) Elliott Wave Technical Analysis 18 January 24

AAVE/U.S. dollar(AAVEUSD) Elliott Wave Technical Analysis dated 18 January 24, Our AAVE/U.S. dollar(...

Read More >
NJ Elliott Wave Technical Analysis Trading Lounge: Daily and 4-Hour Charts for Johnson & Johnson (JNJ) Stock

NJ Elliott Wave Technical Analysis Trading Lounge: Daily and 4-Hour Charts for Johnson & Johnson (JNJ) Stock

This article provides a detailed Elliott Wave analysis of Johnson & Johnson (JNJ), examining potenti...

Read More >

Buy 1 Month

Get 3 Months!

Special Offer:

Trade Recommendations

Unleash the power of deversified trading with our comprehensive portfolio, covering:

  • Stock Trades
  • Crypto Trades
  • Forex Trades
  • Commodity Trades
Elliott Wave Analysis

Gain a competive edge with expert insights in to:

  • Global Indices
  • US Stocks & ASX Stocks
  • Forex & Crypto
  • Commodities
Top-Notch Trading Tools

Equip yourself with the tools of success:

  • Social Chat
  • Elliott Wave Algorithm
  • Screener
  • TradingLevels
  • Trading Game
7 Elliott Wave Analysts

Stay ahead of the market with daily charts and insightful videos
-Your secret to strategic trading!

JOIN HERE


Welcome to TradingLounge (ASIC A.R.No. 321187), specialists in trades, trading education and technical analysis, covering stocks, indices, commodities, forex and cryptocurrencies.

When you join TradingLounge you have access to everything we offer, including trade tools, educational content and a social platform to chat with like-minded investors.

Read more

@Copyright 2024 by tradinglounge.com

Contact Us

Australian no: 02 4787 6020

International no: +61 (2) 47876020

Pay with:

Find us on