18Jul

Rigetti Computing RGTI Triangle Breakout Triggers Wave V With Bullish Price Targets Reaching $65 in Latest Elliott Wave Forecast

Rigetti Computing Inc. (RGTI) Elliott Wave Forecast | Trading Lounge Daily Chart

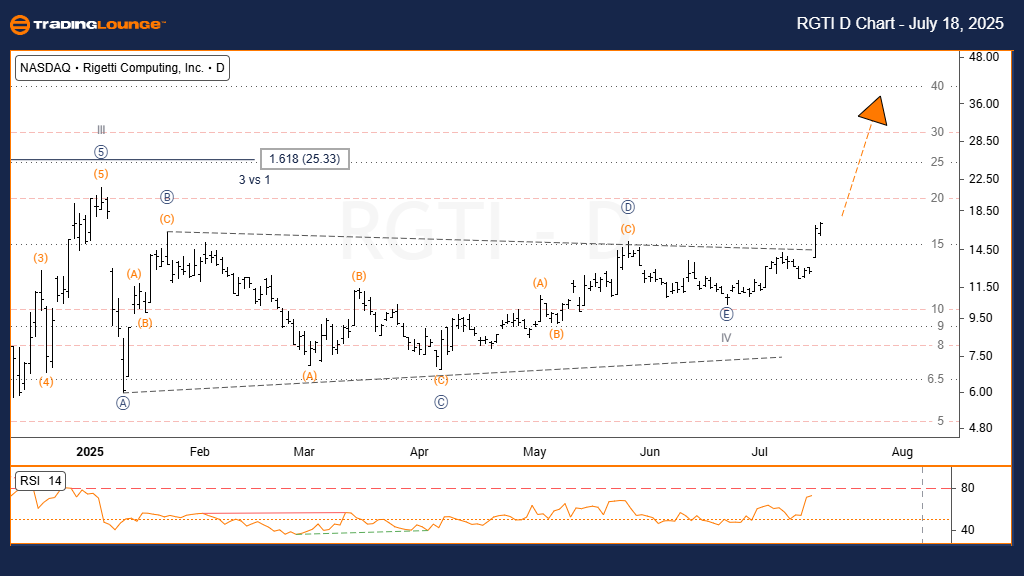
Rigetti Computing Inc. (RGTI) Daily Chart Analysis

Rigetti Computing Inc. (RGTI) Technical Analysis

FUNCTION: Trend

MODE: Motive

STRUCTURE: Impulsive

POSITION: Wave V

DIRECTION: Uptrend

Technical Analysis:

The daily chart for Rigetti Computing Inc. (RGTI) reveals a bullish breakout from a running triangle pattern, confirming the start of Wave V. This development succeeds a completed Wave IV consolidation phase, aligning with classic Elliott Wave Theory. A notable increase in trading volume and momentum supports the bullish continuation of this uptrend.

Going forward, Rigetti Computing stock price is projected to climb, encountering resistance in the $35–$45 range. These levels align with typical post-triangle breakout projections. Traders should look for sustained buying activity to validate the integrity of this Elliott Wave structure.

RGTI-D-Chart-180725


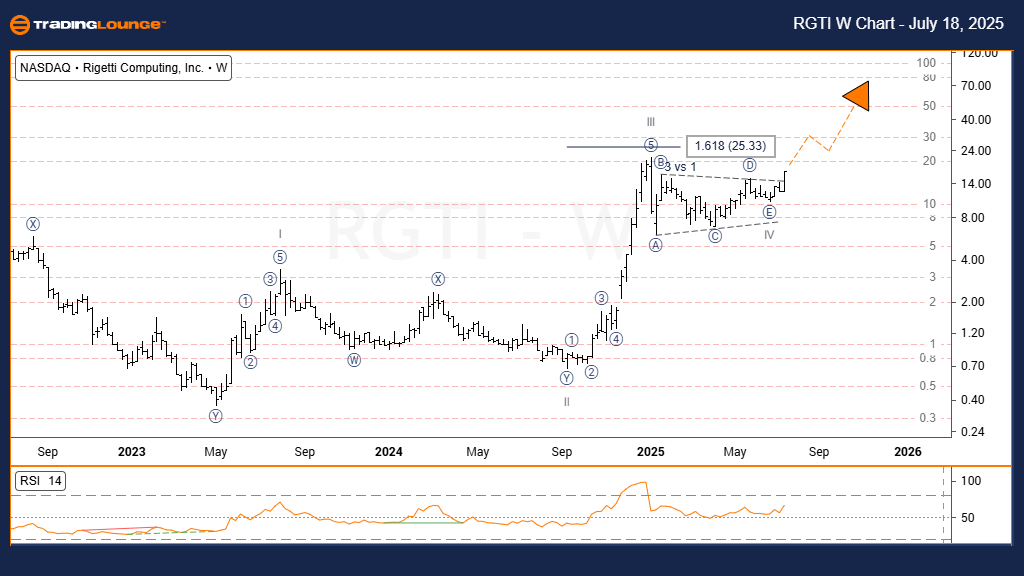
Rigetti Computing Inc. (RGTI) Elliott Wave Forecast | Weekly Chart

Rigetti Computing Inc. (RGTI) Technical Analysis – Trading Lounge

FUNCTION: Trend

MODE: Motive

STRUCTURE: Impulsive

POSITION: Wave V

DIRECTION: Uptrend

Weekly Chart Analysis:

The weekly Elliott Wave chart for RGTI further supports the bullish setup. Wave IV formed as a contracting triangle, consistent with Elliott Wave alternation rules, given Wave II's sharper retracement. A decisive breakout in early July above the triangle boundary marks the initiation of Wave V, which is actively unfolding.

Targets:

  • Initial resistance near $40
  • Potential upside towards $65, calculated using the 1.618 Fibonacci extension of Wave I from the Wave IV low

This RGTI Elliott Wave forecast remains intact as long as the price holds above the Wave IV low, suggesting continued strength in this uptrend scenario.

Technical Analyst: Dhiren Pahuja

Visit: TradingLounge.com for detailed analysis and market updates.

Previous: Micron Technology Inc. (MU) Elliott Wave Technical Analysis

VALUE Offer - $1 for 2 Weeks then $29 a month!Click here

Access 7 Analysts Over 200 Markets Covered. Chat Room With Support

RGTI-W-Chart-180725

Related

Zoom Communications (ZM) Elliott Wave Analysis: Unfolding W–X–Y Correction, and ZM Price Outlook with Daily and Weekly Charts

Zoom Communications (ZM) Elliott Wave Analysis: Unfolding W–X–Y Correction, and ZM Price Outlook with Daily and Weekly Charts

Zoom Communications Inc. (ZM) is undergoing a W–X–Y Elliott Wave corrective pattern with the curre...

Read More >
Asian Paints Elliott Wave Technical Analysis: Share Price Forecast, Financial Overview, Earnings Reports & Market Trends

Asian Paints Elliott Wave Technical Analysis: Share Price Forecast, Financial Overview, Earnings Reports & Market Trends

Asian Paints share price movements, technical analysis, and future stock forecasts guides to cover f...

Read More >
USDJPY Elliott Wave Analysis: Bearish Trend Confirmed with Key Levels, Trading Signals & Risk Management Strategies for Forex Traders

USDJPY Elliott Wave Analysis: Bearish Trend Confirmed with Key Levels, Trading Signals & Risk Management Strategies for Forex Traders

This USDJPY Elliott Wave analysis examines the daily and 4-hour chart trends, highlighting an impuls...

Read More >
NZDUSD Forex Market: Expert New Zealand Dollar/ U.S. Dollar Elliott Wave Technical Analysis and Trading Strategies

NZDUSD Forex Market: Expert New Zealand Dollar/ U.S. Dollar Elliott Wave Technical Analysis and Trading Strategies

Get an in-depth analysis of NZDUSD using Elliott Wave theory. Our analysis covers the current trend,...

Read More >
S&P/TSX 60 Elliott Wave Analysis: Orange Wave 4 Corrective Phase, Wave Predictions, Bullish Trends, and Market Insights

S&P/TSX 60 Elliott Wave Analysis: Orange Wave 4 Corrective Phase, Wave Predictions, Bullish Trends, and Market Insights

Gain valuable insights into the S&P/TSX 60 Index with a thorough Elliott Wave analysis. Explore the ...

Read More >
Hindustan Unilever Technical Analysis: Actionable Insights into HINDUNILVR Stock Trends and Forecasted Market Movements

Hindustan Unilever Technical Analysis: Actionable Insights into HINDUNILVR Stock Trends and Forecasted Market Movements

This article provides an in-depth analysis of Hindustan Unilever (HINDUNILVR) using Elliott Wave the...

Read More >

$1 for 2 Weeks

then $29 a month!

What a Special Offer!

Trade Recommendations

Unleash the power of deversified trading with our comprehensive portfolio, covering 250+ markets:

  • Stock Trades
  • Crypto Trades
  • Forex Trades
  • Commodity Trades
Elliott Wave Analysis

Gain a competitive edge with expert insights and AI-powered Elliott Wave charting into:

  • Global Indices
  • US Stocks & ASX Stocks
  • Forex & Crypto
  • Commodities
Top-Notch Trading Tools

Equip yourself with the tools of success:

  • Real-time Chat rooms
  • Elliott Wave Algorithm
  • Portfolio tools
  • TradingLevels
  • Screener
  • Trading Game
7 Elliott Wave Analysts

Stay ahead of the market with daily charts and insightful videos
Your secret to strategic trading!

JOIN HERE


Welcome to TradingLounge (ASIC A.R.No. 321187), specialists in trades, trading education and technical analysis, covering stocks, indices, commodities, forex and cryptocurrencies.

When you join TradingLounge you have access to everything we offer, including trade tools, educational content and a social platform to chat with like-minded investors.

Read more

@Copyright 2024 by tradinglounge.com

Contact Us

Australian no: 02 4787 6020

International no: +61 (2) 47876020

Pay with:

Find us on