17Jul

Micron Technology Inc (MU) Elliott Wave Technical Forecast Shows Bullish Trend Toward Wave v With Key Fibonacci Levels for Entry

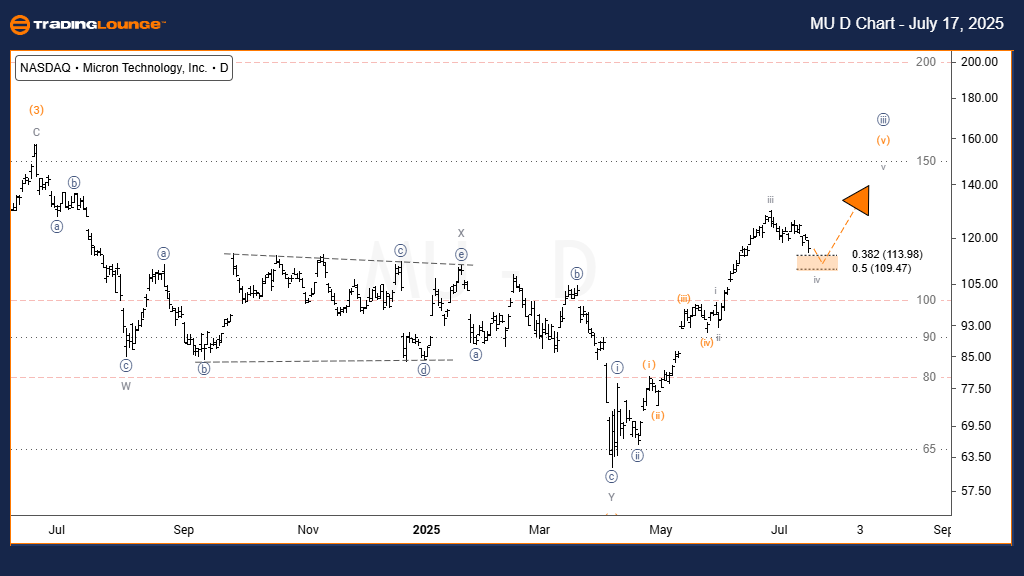
Micron Technology Inc (MU) Elliott Wave Forecast – Trading Lounge Daily Chart

Micron Technology Inc (MU) Daily Chart Overview

MU Elliott Wave Technical Analysis

Function: Trend

Mode: Motive

Structure: Impulsive

Position: Wave (v) of {v}

Direction: Uptrend

Details: Price expected to advance toward wave (v) upon completion of wave iv

On the daily chart, Micron Technology Inc. (MU) is following a clear impulsive Elliott Wave structure. The stock has completed wave iii of (v) and is currently correcting through wave iv. This pullback is likely to reach the 38.2% to 50% Fibonacci retracement of wave iii.

Once wave iv completes, technical forecasts suggest a potential surge through wave v of (v), concluding the broader wave (v) of {iii} cycle. Traders and investors should observe these Fibonacci levels closely, as they may offer bullish opportunities ahead of the expected final leg upward in this motive wave structure.

MU-US-Stock-D-Chart-...


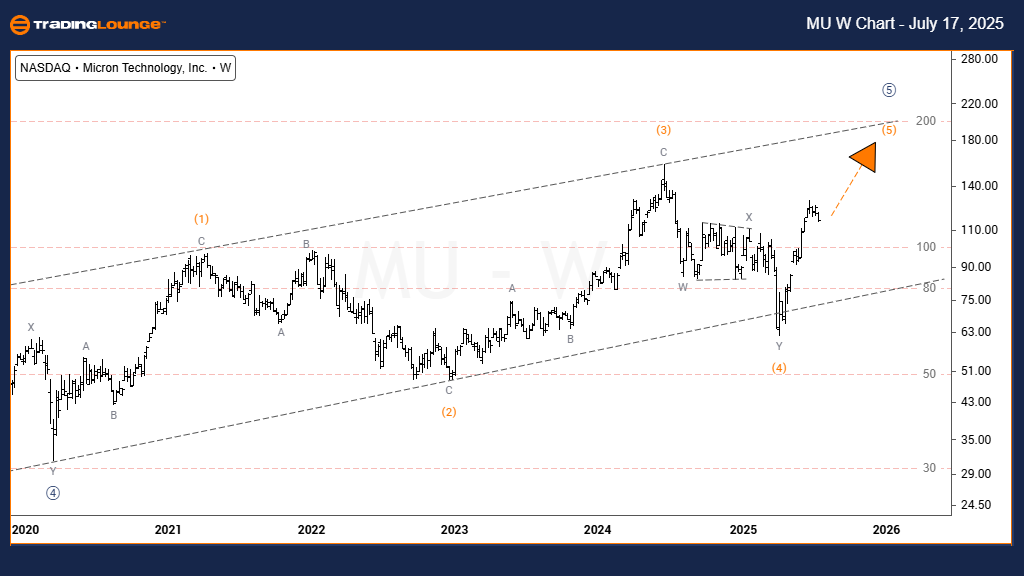
Micron Technology Inc (MU) – Elliott Wave Forecast (Weekly Chart)

MU US Stock Technical Analysis Overview – Trading Lounge

Function: Trend

Mode: Motive

Structure: Impulsive

Position: Wave (5) of {5}

Direction: Uptrend

Details: Price advancing within wave (5) of {5}, aiming for the upper boundary of a parallel trend channel

In the weekly chart, Micron Technology Inc. (MU) maintains a strong uptrend and trades within a structured parallel channel. Following the completion of wave {4} as a double zigzag corrective pattern, MU initiated wave {5}, which is progressing with impulsive characteristics.

Currently unfolding wave (5) is projected to test the upper resistance of the channel, a logical target for this final wave advance. Any short-term pullbacks may present favorable buying setups, as long as the impulsive structure remains intact. The broader trend remains bullish, supported by the ongoing wave development.

Technical Analyst: Dhiren Pahuja

Visit: TradingLounge.com for detailed analysis and market updates.

Previous: Coinbase (COIN) Elliott Wave Technical Analysis

VALUE Offer - $1 for 2 Weeks then $29 a month!Click here

Access 7 Analysts Over 200 Markets Covered. Chat Room With Support

MU-US-Stock-w-Chart-...

Related

ADANI PORTS and SEZ Indian Stocks Elliott Wave Technical Analysis: Share Price Insights, Market Trends, and Forecasts

ADANI PORTS and SEZ Indian Stocks Elliott Wave Technical Analysis: Share Price Insights, Market Trends, and Forecasts

Elliott Wave analysis of ADANI PORTS, focusing on key technical insights, price predictions, and pot...

Read More >
Specific Price levels and Market Trends for ASX REA GROUP LTD – REA Stock Analysis & Elliott Wave Technical Forecast

Specific Price levels and Market Trends for ASX REA GROUP LTD – REA Stock Analysis & Elliott Wave Technical Forecast

This article provides a comprehensive Elliott Wave analysis of ASX: REA GROUP LTD. It includes detai...

Read More >
VeChain / U.S. dollar(VETUSD) Elliott Wave Technical Analysis 26 January 24

VeChain / U.S. dollar(VETUSD) Elliott Wave Technical Analysis 26 January 24

TradingLounge Daily Chart and 4-Hour Chart for VeChain/U.S. dollar Elliott Wave Technical Analysis d...

Read More >
Elliott Wave Analysis for NASDAQ 100 & Tech Stocks: Insights & Strategies for NDX, SP500, and Major Companies

Elliott Wave Analysis for NASDAQ 100 & Tech Stocks: Insights & Strategies for NDX, SP500, and Major Companies

This summary provides a comprehensive Elliott Wave analysis of the NASDAQ 100 (NDX) and major techno...

Read More >
USDJPY Elliott Wave Analysis Highlights Bearish Trend, Impulsive Wave Development, and Trading Strategy for Forex Market Forecast

USDJPY Elliott Wave Analysis Highlights Bearish Trend, Impulsive Wave Development, and Trading Strategy for Forex Market Forecast

This detailed Elliott Wave analysis for USDJPY highlights a bearish impulsive trend in progress, off...

Read More >
Polkadot DOTUSD Elliott Wave Analysis Predicts Wave III Bullish Breakout After ABC Correction and Fibonacci Level Confirmation

Polkadot DOTUSD Elliott Wave Analysis Predicts Wave III Bullish Breakout After ABC Correction and Fibonacci Level Confirmation

Polkadot (DOTUSD) may have completed wave II at 3.737 near the 0.618 Fibonacci level. A confirmed br...

Read More >

$1 for 2 Weeks

then $29 a month!

What a Special Offer!

Trade Recommendations

Unleash the power of deversified trading with our comprehensive portfolio, covering 250+ markets:

  • Stock Trades
  • Crypto Trades
  • Forex Trades
  • Commodity Trades
Elliott Wave Analysis

Gain a competitive edge with expert insights and AI-powered Elliott Wave charting into:

  • Global Indices
  • US Stocks & ASX Stocks
  • Forex & Crypto
  • Commodities
Top-Notch Trading Tools

Equip yourself with the tools of success:

  • Real-time Chat rooms
  • Elliott Wave Algorithm
  • Portfolio tools
  • TradingLevels
  • Screener
  • Trading Game
7 Elliott Wave Analysts

Stay ahead of the market with daily charts and insightful videos
Your secret to strategic trading!

JOIN HERE


Welcome to TradingLounge (ASIC A.R.No. 321187), specialists in trades, trading education and technical analysis, covering stocks, indices, commodities, forex and cryptocurrencies.

When you join TradingLounge you have access to everything we offer, including trade tools, educational content and a social platform to chat with like-minded investors.

Read more

@Copyright 2024 by tradinglounge.com

Contact Us

Australian no: 02 4787 6020

International no: +61 (2) 47876020

Pay with:

Find us on