Welcome to our latest Elliott Wave analysis for Eaton Corp PLC (ETN). This analysis delves into ETN's price movements utilizing Elliott Wave Theory, offering traders insights into potential trading opportunities based on current trends and market structure. We explore both the daily and 4-hour charts for a thorough understanding of ETN's market trajectory.

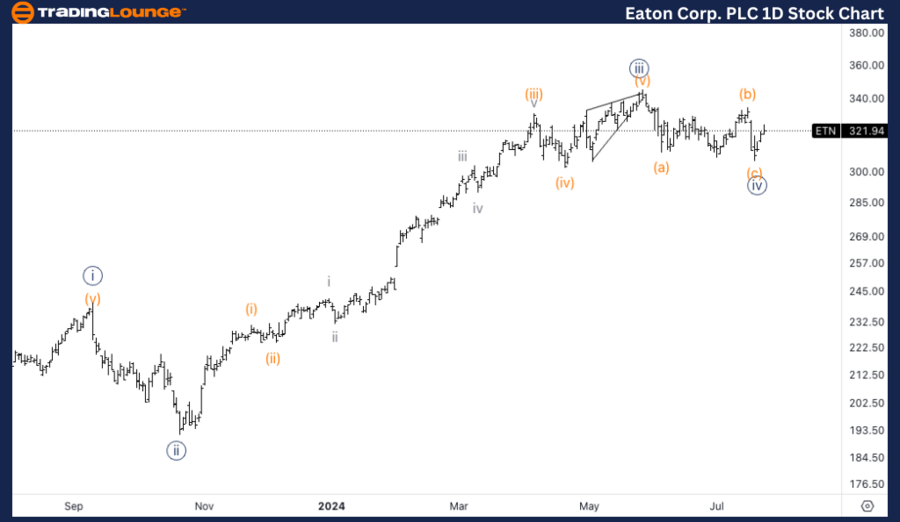
ETN Elliott Wave Analysis Trading Lounge Daily Chart

Eaton Corp PLC (ETN) Daily Chart Analysis

ETN Elliott Wave Technical Analysis

Function: Trend

Mode: Impulsive

Structure: Motive

Position: Minute {v}

Direction: Upside in wave {v}

Details: A clear three-wave movement into wave {iv} occurred just below the 0.618 retracement level of wave {ii}. The support at MG1 indicates potential for further upward movement in wave {v}.

ETN Elliott Wave Technical Analysis – Daily Chart
The daily chart exhibits a distinct three-wave progression into wave {iv}, which terminated just short of the 0.618 retracement level of wave {ii}. The presence of support at MG1 suggests a likelihood of further gains in wave {v}. Traders should watch the support level for signals of sustained upward momentum.

Eaton-Corp-PLC-1day-...


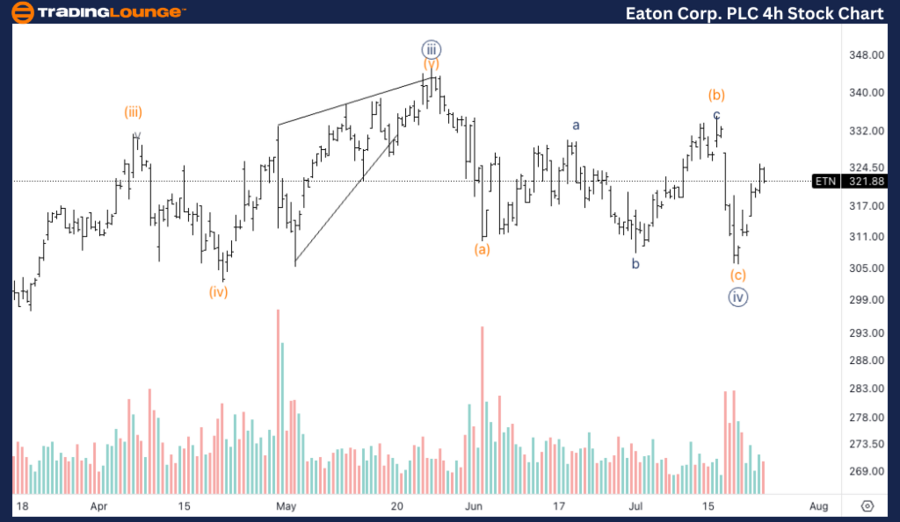
ETN Elliott Wave Analysis Trading Lounge 4H Chart

Eaton Corp PLC (ETN) 4H Chart Analysis

ETN Elliott Wave Technical Analysis

Function: Trend

Mode: Impulsive

Structure: Motive

Position: Wave (i) of {v}

Direction: Upside in wave {v}

Details: The 4-hour chart suggests a potential top in wave (i) of {v}, with volume spikes indicating that a low might be established. A breakout and sustained support above $320 would confirm the upward trend, indicating a continuation in wave {v}.

ETN Elliott Wave Technical Analysis – 4H Chart
The 4-hour chart points to a potential top in wave (i) of {v}, with increased volume indicating a possible bottom. A decisive break above $320, followed by support, would affirm the bullish trend, paving the way for a further rise in wave {v}.

Technical Analyst: Alessio Barretta

Source: visit Tradinglounge.com and learn From the Experts Join TradingLounge Here 

See Previous: The Coca-Cola Company (KO) Elliott Wave Technical Analysis

Special Trial Offer - 0.76 Cents a Day for 3 Months! Click here

Access 7 Analysts Over 170 Markets Covered. Chat Room With Support

Eaton-Corp-PLC-4hr-s...

Related

New Zealand Dollar/U.S. Dollar (NZDUSD) Elliott Wave Technical Analysis: 4-Hour & Daily Chart Overview, February 13, 2024

New Zealand Dollar/U.S. Dollar (NZDUSD) Elliott Wave Technical Analysis: 4-Hour & Daily Chart Overview, February 13, 2024

Expert insights into NZDUSD analysis and forecasts, covering the New Zealand Dollar/U.S. Dollar curr...

Read More >
KOSPI Composite is in a Bullish Trend - KOSPI Elliott Wave Technical Analysis on the Daily and Weekly Charts

KOSPI Composite is in a Bullish Trend - KOSPI Elliott Wave Technical Analysis on the Daily and Weekly Charts

The KOSPI Composite is in a bullish trend, confirmed by Elliott Wave analysis on the daily and weekl...

Read More >
Theta Token / U.S. dollar(THETAUSD) Elliott Wave Technical Analysis 14 November 23

Theta Token / U.S. dollar(THETAUSD) Elliott Wave Technical Analysis 14 November 23

Theta Token / U.S. dollar(THETAUSD) Elliott Wave Technical Analysis 14 November 23,

Read More >
BRAMBLES LIMITED - BXB Stock Analysis: Elliott Wave Forecast, Key Price Levels, and ASX Trading Insights for Success

BRAMBLES LIMITED - BXB Stock Analysis: Elliott Wave Forecast, Key Price Levels, and ASX Trading Insights for Success

BRAMBLES LIMITED (ASX:BXB) highlights the potential upward momentum of the ((3))-navy wave. Key insi...

Read More >
NZDUSD Elliott Wave Analysis Reveals Strong Bullish Wave 3 Trend with Critical Invalidation Level and Multitimeframe Trading Setup

NZDUSD Elliott Wave Analysis Reveals Strong Bullish Wave 3 Trend with Critical Invalidation Level and Multitimeframe Trading Setup

This analysis provides a detailed NZDUSD Elliott Wave outlook, highlighting a bullish impulsive wave...

Read More >
Elliott Wave Analysis: Long Trades,  S&P 500, NASDAQ 100, RUSSELL 2000, DAX 40, FTSE 100, ASX 200.

Elliott Wave Analysis: Long Trades, S&P 500, NASDAQ 100, RUSSELL 2000, DAX 40, FTSE 100, ASX 200.

Elliott Wave Analysis points towards an upward movement in major indices like the S&P 500, NASDAQ 10...

Read More >

$1 for 2 Weeks

then $29 a month!

What a Special Offer!

Trade Recommendations

Unleash the power of deversified trading with our comprehensive portfolio, covering 250+ markets:

  • Stock Trades
  • Crypto Trades
  • Forex Trades
  • Commodity Trades
Elliott Wave Analysis

Gain a competitive edge with expert insights and AI-powered Elliott Wave charting into:

  • Global Indices
  • US Stocks & ASX Stocks
  • Forex & Crypto
  • Commodities
Top-Notch Trading Tools

Equip yourself with the tools of success:

  • Real-time Chat rooms
  • Elliott Wave Algorithm
  • Portfolio tools
  • TradingLevels
  • Screener
  • Trading Game
7 Elliott Wave Analysts

Stay ahead of the market with daily charts and insightful videos
Your secret to strategic trading!

JOIN HERE


Welcome to TradingLounge (ASIC A.R.No. 321187), specialists in trades, trading education and technical analysis, covering stocks, indices, commodities, forex and cryptocurrencies.

When you join TradingLounge you have access to everything we offer, including trade tools, educational content and a social platform to chat with like-minded investors.

Read more

@Copyright 2024 by tradinglounge.com

Contact Us

Australian no: 02 4787 6020

International no: +61 (2) 47876020

Pay with:

Find us on