17Jul

COIN Elliott Wave Technical Analysis: Coinbase Global Inc. U.S. Stocks Daily & Weekly Impulse Analysis With Fibonacci Extension

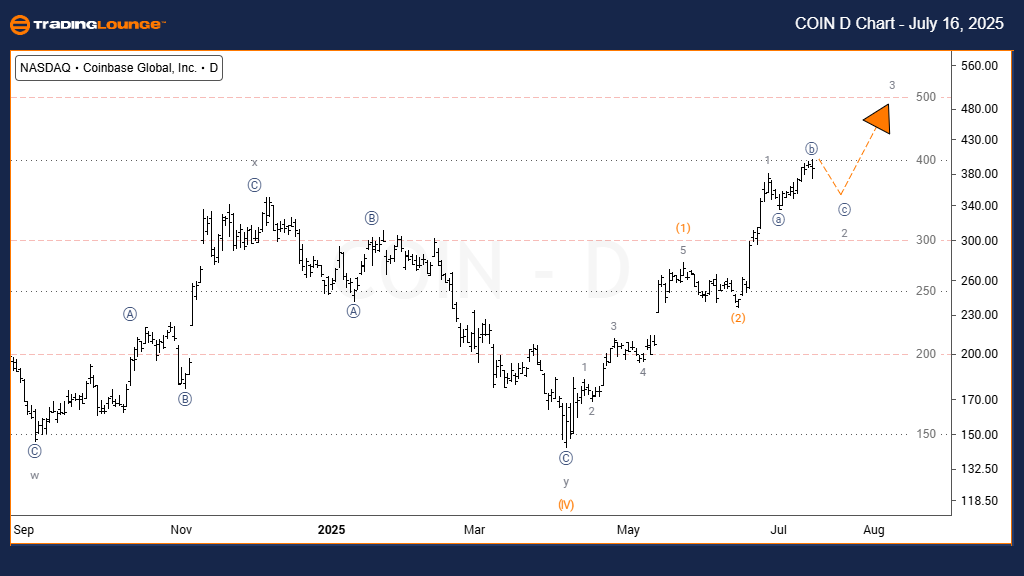
Coinbase Global Inc. (COIN) Elliott Wave Analysis - Trading Lounge Daily Chart

Coinbase Global Inc. (COIN) Daily Chart Overview

Coinbase Global Inc. (COIN) Elliott Wave Technical Analysis

FUNCTION: Trend

MODE: Motive

STRUCTURE: Impulsive

POSITION: Wave (Y) of {B}

DIRECTION: Uptrend

DETAILS: Anticipating acceleration in wave 3 of (3), which is typically a strong momentum phase in Elliott Wave theory.

Coinbase Global Inc. (NASDAQ: COIN) is showing an impulsive Elliott Wave formation on the daily timeframe. The initial waves (1) and (2) in orange have finalized, and the price is progressing into the third wave (3). Subwave 1 of wave (3) has concluded, while subwave 2 is unfolding. Once subwave 2 ends, a strong rally in wave 3 of (3) is expected, with a potential Fibonacci 161.8% extension of wave (1) as a price target.

The wave integrity remains consistent, showing no overlaps, and follows the standard Elliott Wave guidelines. The current price action confirms a motive pattern, with alternation and Fibonacci projections reinforcing the bullish trend outlook.

COIN-D-Chart-160725


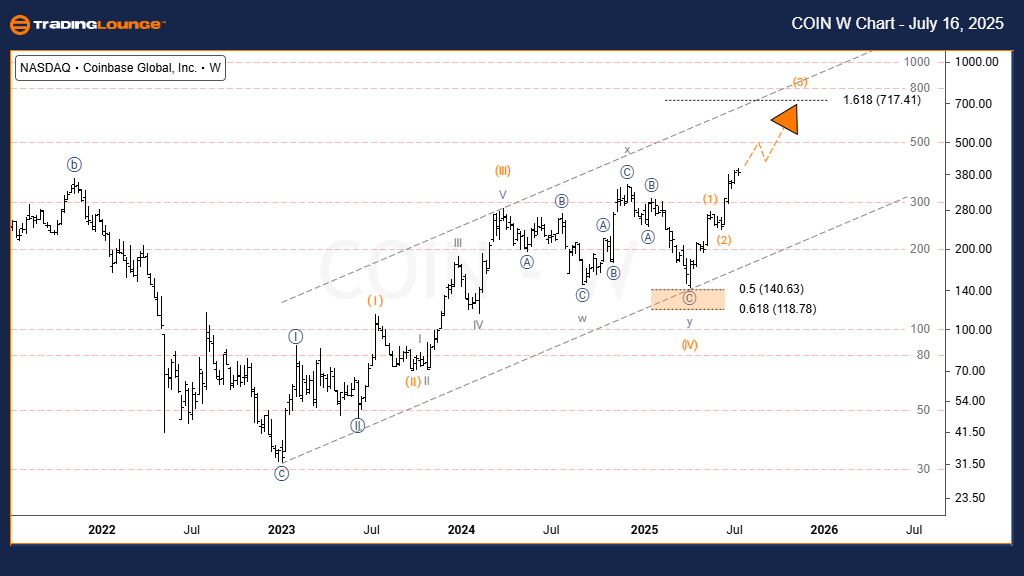
Coinbase Global Inc. (COIN) Elliott Wave Analysis (TradingLounge Weekly Chart)

Coinbase Global Inc. (COIN) Technical Overview

FUNCTION: Trend

MODE: Motive

STRUCTURE: Impulsive

POSITION: Wave IV of (c)

DIRECTION: Uptrend

DETAILS: Targeting the 161.8% Fibonacci projection of primary wave {1}, indicating a likely completion zone for navy blue wave {3}.

On the weekly chart, Coinbase (COIN) maintains its structure within a long-term bullish impulse cycle. The asset is now tracking through wave (V) of {III}, following the completion of corrective wave (IV). The projected move aims at the 161.8% Fibonacci extension of wave {1}, a classic target for third waves in impulsive sequences.

The internal wave count remains clean, with clear segmentation and adherence to motive wave principles. This ongoing setup supports the potential for a strong upward continuation, aligned with the broader bullish Elliott Wave framework.

Technical Analyst: Dhiren Pahuja

Visit: TradingLounge.com for detailed analysis and market updates.

Previous: Adobe Inc. (ADBE) Elliott Wave Technical Analysis

VALUE Offer - $1 for 2 Weeks then $29 a month!Click here

Access 7 Analysts Over 200 Markets Covered. Chat Room With Support

COIN-W-Chart-160725

Related

Costco Wholesale Corp. (COST) Daily Chart Analysis Using Elliott Wave Theory - February 2nd, 2024

Costco Wholesale Corp. (COST) Daily Chart Analysis Using Elliott Wave Theory - February 2nd, 2024

Gain insights into COST Elliott Wave analysis for Costco Wholesale Corp. (COST) on February 24, 2024...

Read More >
Texas Instruments Inc.(TXN) Stocks Elliott Wave Technical Analysis: A Comprehensive Guide

Texas Instruments Inc.(TXN) Stocks Elliott Wave Technical Analysis: A Comprehensive Guide

Elliott Wave analysis on Texas Instruments Inc. (TXN), examining both its daily and 4-hour chart tre...

Read More >
Chainlink /U.S. Dollar Crypto Price News & LINKUSD Elliott Wave Forecast: Bullish Wave (3) Targets $18.94 and Resistance at $22

Chainlink /U.S. Dollar Crypto Price News & LINKUSD Elliott Wave Forecast: Bullish Wave (3) Targets $18.94 and Resistance at $22

This Elliott Wave breakdown of LINKUSD highlights bullish momentum targeting $18.94. Key support hol...

Read More >
Deere & Co. Stocks Elliott Wave Technical Analysis include DE stock trends, Anticipated Price Targets, and Support Levels.

Deere & Co. Stocks Elliott Wave Technical Analysis include DE stock trends, Anticipated Price Targets, and Support Levels.

This analysis offers a comprehensive look at Deere & Co. (DE) through Elliott Wave Theory, focusing ...

Read More >
Texas Instruments Inc.(TXN) Stocks Elliott Wave Technical Analysis: Daily and 4-Hour Elliott Wave Overview

Texas Instruments Inc.(TXN) Stocks Elliott Wave Technical Analysis: Daily and 4-Hour Elliott Wave Overview

This article provides an in-depth Elliott Wave analysis of Texas Instruments Incorporated (TXN), foc...

Read More >
WTI Crude Oil Price Outlook: Elliott Wave Analysis Predicts $50 Target as Bearish Trend Holds Below $72 Resistance Level

WTI Crude Oil Price Outlook: Elliott Wave Analysis Predicts $50 Target as Bearish Trend Holds Below $72 Resistance Level

WTI crude oil continues a bearish Elliott Wave correction. Resistance at $72 limits gains, with down...

Read More >

$1 for 2 Weeks

then $29 a month!

What a Special Offer!

Trade Recommendations

Unleash the power of deversified trading with our comprehensive portfolio, covering 250+ markets:

  • Stock Trades
  • Crypto Trades
  • Forex Trades
  • Commodity Trades
Elliott Wave Analysis

Gain a competitive edge with expert insights and AI-powered Elliott Wave charting into:

  • Global Indices
  • US Stocks & ASX Stocks
  • Forex & Crypto
  • Commodities
Top-Notch Trading Tools

Equip yourself with the tools of success:

  • Real-time Chat rooms
  • Elliott Wave Algorithm
  • Portfolio tools
  • TradingLevels
  • Screener
  • Trading Game
7 Elliott Wave Analysts

Stay ahead of the market with daily charts and insightful videos
Your secret to strategic trading!

JOIN HERE


Welcome to TradingLounge (ASIC A.R.No. 321187), specialists in trades, trading education and technical analysis, covering stocks, indices, commodities, forex and cryptocurrencies.

When you join TradingLounge you have access to everything we offer, including trade tools, educational content and a social platform to chat with like-minded investors.

Read more

@Copyright 2024 by tradinglounge.com

Contact Us

Australian no: 02 4787 6020

International no: +61 (2) 47876020

Pay with:

Find us on