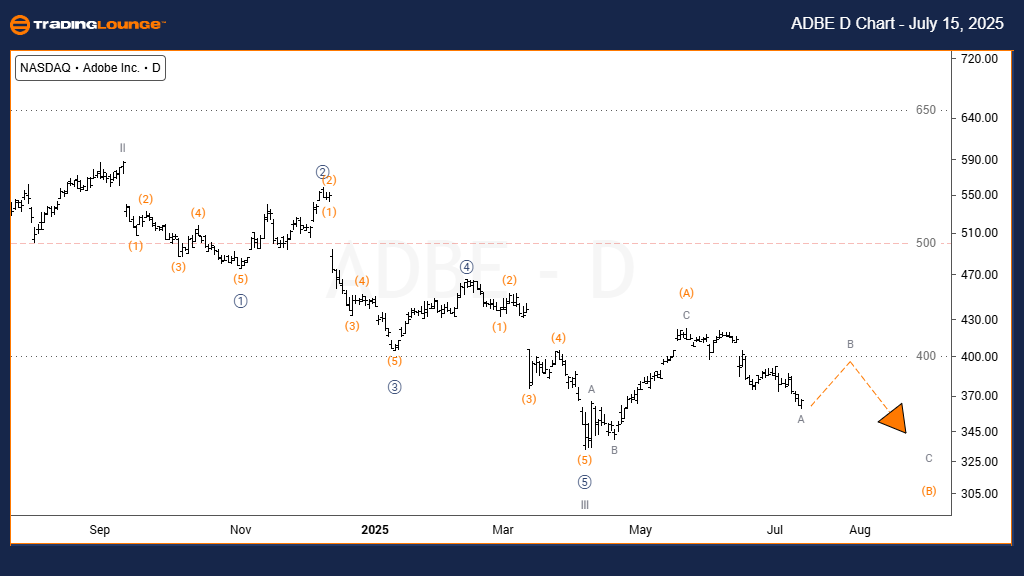
Adobe Inc. (ADBE) Elliott Wave Analysis – TradingLounge Daily Chart
Adobe Inc. (ADBE) Daily Chart Analysis
Adobe Inc. (ADBE) Elliott Wave Technical Analysis
Function: Counter-Trend
Mode: Corrective
Structure: Flat Correction
Position: Wave (Y) of {B}
Direction: Downtrend
Details: Wave (B) is expected to end near the Wave III peak, within the 325–330 price zone, ahead of a potential move lower into wave (C).
Adobe Inc. (NASDAQ: ADBE) is currently exhibiting a flat correction pattern on the daily chart, as part of wave (Y) of {B}, which follows the completion of wave III. In adherence to the Elliott Wave principle of alternation, given that wave II formed a zigzag, wave {B} is likely to emerge as a flat or a triangle.
The initial phase, wave (A), appears to be complete. Presently, wave (B) is developing and could reach termination near the 325–330 zone, aligning with the high from wave III. This structure is coherent with Elliott Wave corrective guidelines, particularly in terms of proportion and symmetry, reinforcing the flat correction scenario.
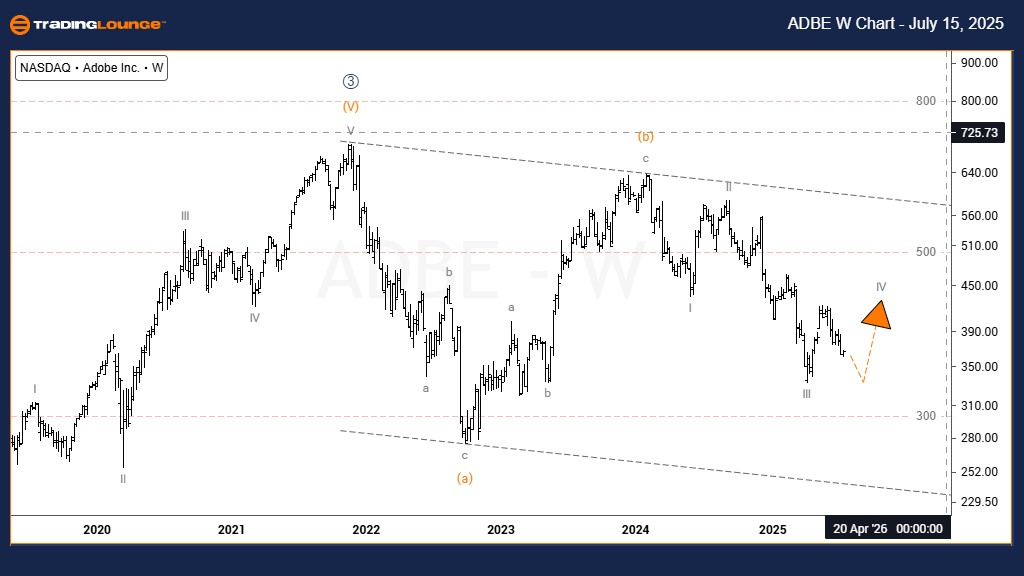
Adobe Inc. (ADBE) Elliott Wave Technical Analysis – Weekly Chart
Adobe Inc. (ADBE) Technical Analysis – Trading Lounge
Function: Trend
Mode: Motive
Structure: Impulsive
Position: Wave IV of (c)
Direction: Uptrend
Details: The market is forming a zigzag correction within a defined parallel channel as part of wave IV of (c), with an anticipated bullish continuation in wave V.
On the weekly timeframe, Adobe Inc. remains in a corrective phase following a significant impulsive advance. This retracement takes the shape of a zigzag (a)-(b)-(c), which is a common corrective pattern in Elliott Wave theory. Waves (a) and (b) are already completed, and the ongoing wave (c) is currently active.
Within wave (c), the price action has developed into wave IV, which is progressing inside a parallel channel structure. This intermediate correction is consistent with the broader uptrend and is likely setting the stage for a continuation toward wave V. The medium- to long-term outlook for ADBE remains bullish, making this a potential opportunity zone for trend-following traders.
Technical Analyst: Dhiren Pahuja
Visit: TradingLounge.com for detailed analysis and market updates.
Previous:Zoom Communications Inc. (ZM) Elliott Wave Technical Analysis
VALUE Offer - $1 for 2 Weeks then $29 a month!Click here
Access 7 Analysts Over 200 Markets Covered. Chat Room With Support