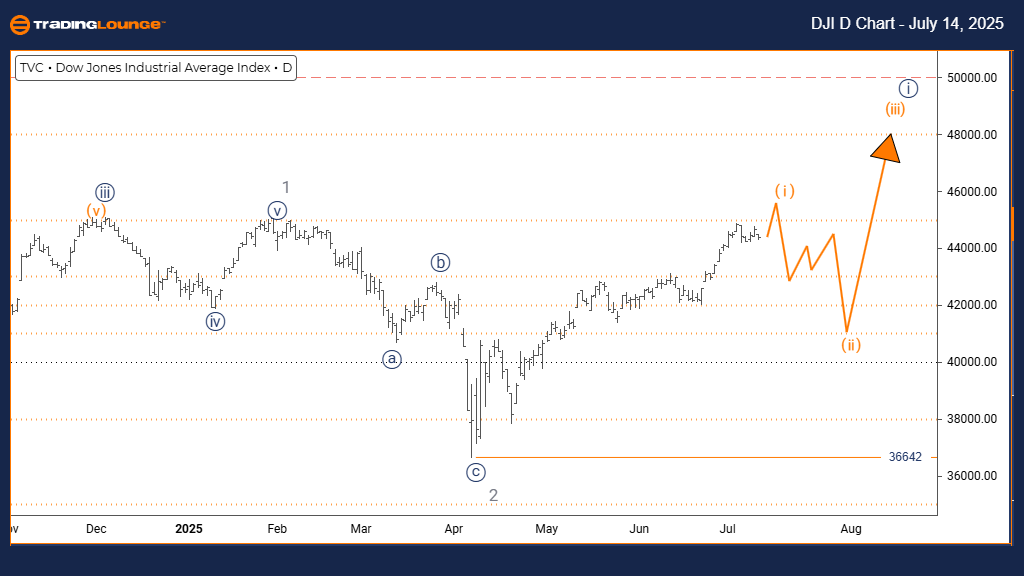
Zoom Communications Inc. (ZM) – Elliott Wave Analysis – Daily Chart
Zoom Communications Inc. (ZM) Daily Chart Analysis
ZM Elliott Wave Technical Analysis
Function: Countertrend
Mode: Corrective
Structure: Complex Correction
Position: Wave (Y) of {B}
Direction: Downtrend
Details: Price action is unfolding inside a well-defined parallel channel as Wave (Y) evolves; Waves (W) and (X) have already completed.
Zoom Communications Inc. (ZM) is currently navigating through a complex corrective structure on the daily chart, characterized by a W–X–Y Elliott Wave pattern. Waves (W) and (X) have reached completion, and price movement is now progressing in Wave (Y), which is developing within a parallel channel.
This wave formation aligns with the larger corrective structure of Wave {B}, indicating that the retracement remains consistent with Elliott Wave principles. Fibonacci extension levels suggest that Wave (Y) could potentially reach the 100% extension of Wave (W), aligning with the channel's lower boundary and acting as a probable support zone.
The current Elliott Wave outlook remains intact as long as price levels stay below the origin of Wave (W), maintaining the validity of the downward correction.
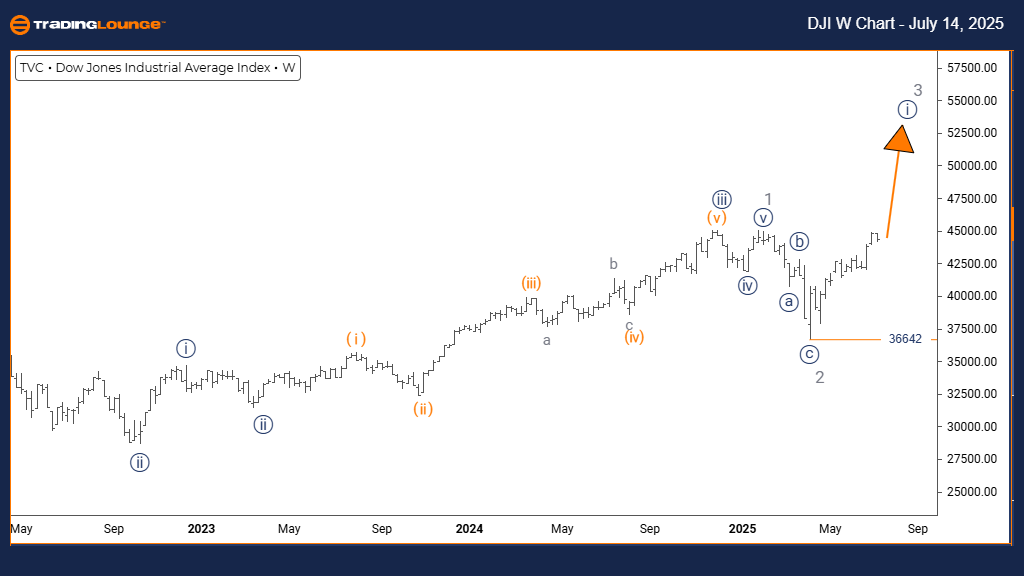
Zoom Communications Inc. (ZM) – Elliott Wave Technical Analysis – Weekly Chart
Function: Countertrend
Mode: Corrective
Structure: Double Three / Complex Correction
Position: Wave {B}
Direction: Downtrend
Details: A higher-degree W–X–Y corrective pattern is forming. Wave {C} is projected following the conclusion of Wave (Y).
On the weekly chart, Zoom Communications Inc. (ZM) continues within a higher-degree corrective move identified as a W–X–Y double three structure, categorized under Wave {B}. The internal segments of Waves (W) and (X) are clearly visible when analyzed on the daily chart.
Wave (Y) is developing in alignment with this broader corrective phase, adhering to the principles of Elliott Wave Theory. Upon the completion of Wave (Y), the structure is expected to pivot into an impulsive Wave {C}, which could signal a medium-term bullish reversal and the end of the corrective cycle.
Wave relationships, including the symmetry between Waves (W) and (Y) and the guideline of alternation, further reinforce the credibility of this Elliott Wave analysis for ZM stock.
Technical Analyst: Dhiren Pahuja
Visit: TradingLounge.com for detailed analysis and market updates.
Previous: Riot Platforms, Inc. (RIOT) Elliott Wave Technical Analysis
VALUE Offer - Buy 1 Month & Get 3 Months!Click here
Access 7 Analysts Over 200 Markets Covered. Chat Room With Support