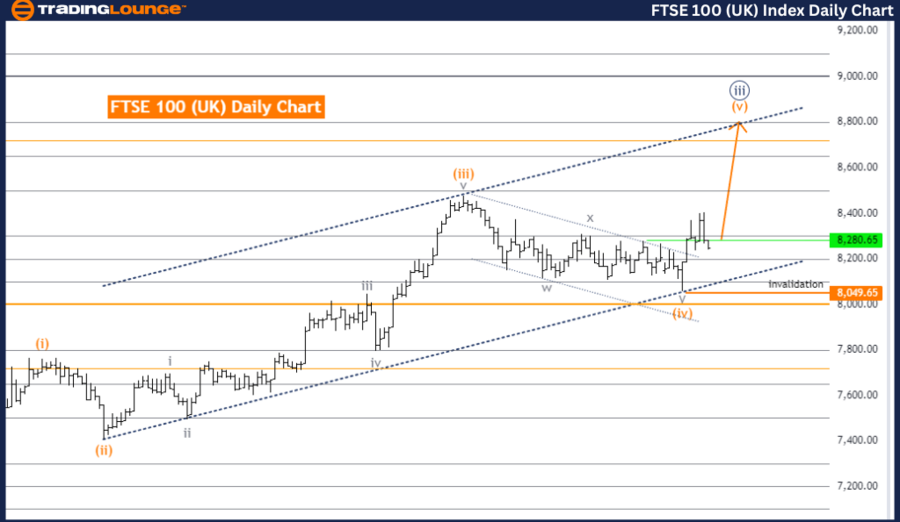
FTSE 100 (UK) Elliott Wave Analysis - Day Chart
FTSE 100 (UK) Day Chart Analysis
FTSE 100 (UK) Elliott Wave Technical Analysis
Function: Trend
Mode: Impulsive
Structure: Orange Wave 5
Position: Navy Blue Wave 3
Direction Next Lower Degrees: Navy Blue Wave 4
Details: Orange wave 4 looks completed. Now, orange wave 5 of navy blue wave 3 is in play.
Wave Cancel Invalid Level: 8,049.65
The FTSE 100 Elliott Wave Analysis for the day chart highlights a trend function in an impulsive mode. The current wave structure is orange wave 5, within the larger navy blue wave 3. This indicates a strong upward movement, driven by the final wave of the current impulsive sequence.
Currently, the market is positioned in navy blue wave 3, suggesting it is in the third wave of a larger degree trend, which is typically the most powerful and extended wave in Elliott Wave theory. Following this, the market is expected to enter navy blue wave 4, a corrective phase that will temporarily counter the primary upward trend before resuming.
The analysis indicates that orange wave 4 is likely completed, meaning the market has finished its corrective phase and is transitioning into orange wave 5 of navy blue wave 3. This phase represents the final push of the current impulsive sequence before a larger corrective phase begins. The completion of orange wave 4 suggests the market is ready for another upward movement.
The wave cancel invalid level is 8,049.65. This level is critical for validating the current wave structure. If the FTSE 100 falls below this threshold, the existing wave count would be invalidated, necessitating a reassessment of the market's direction.
In summary, the FTSE 100 Elliott Wave Analysis on the day chart indicates the market is in the impulsive phase of orange wave 5, positioned within navy blue wave 3. The current phase suggests strong upward momentum, with a corrective phase expected to follow, represented by navy blue wave 4. The wave cancel invalid level of 8,049.65 is crucial for validating the current wave structure, and any breach of this level would require a reassessment of the wave count.
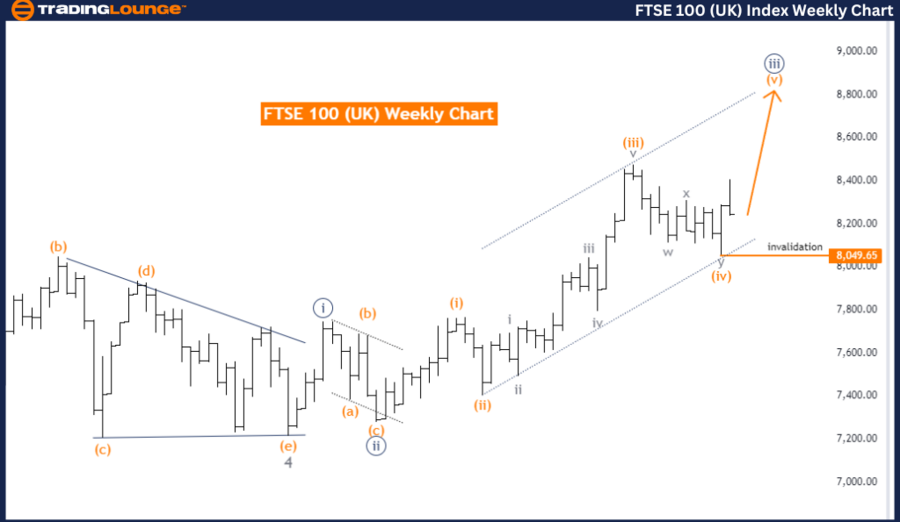
FTSE 100 (UK) Elliott Wave Analysis - Weekly Chart
FTSE 100 (UK) Weekly Chart Analysis
FTSE 100 (UK) Elliott Wave Technical Analysis
Function: Trend
Mode: Impulsive
Structure: Orange Wave 5
Position: Navy Blue Wave 3
Direction Next Lower Degrees: Navy Blue Wave 4
Details: Orange wave 4 looks completed. Now, orange wave 5 of navy blue wave 3 is in play.
Wave Cancel Invalid Level: 8,049.65
The FTSE 100 Elliott Wave Analysis for the weekly chart indicates a trend function in an impulsive mode. The current wave structure is orange wave 5, part of the larger navy blue wave 3. This suggests a strong upward movement in the market, driven by the final wave of the current impulsive sequence.
Currently, the market is positioned in navy blue wave 3, indicating it is in the third wave of a larger degree trend, typically the most powerful and extended wave in Elliott Wave theory. After this phase, the market is expected to enter navy blue wave 4, a corrective phase that will temporarily counter the primary upward trend before resuming.
The analysis indicates that orange wave 4 appears completed, meaning the market has finished its corrective phase and is transitioning into orange wave 5 of navy blue wave 3. This phase represents the final push of the current impulsive sequence before a larger corrective phase begins. The completion of orange wave 4 suggests the market is ready for another upward movement.
The wave cancel invalid level is 8,049.65. This level is crucial for validating the current wave structure. If the FTSE 100 falls below this threshold, the existing wave count would be invalidated, necessitating a reassessment of the market's direction.
In summary, the FTSE 100 Elliott Wave Analysis on the weekly chart indicates the market is in the impulsive phase of orange wave 5, positioned within navy blue wave 3. The current phase suggests strong upward momentum, with a corrective phase expected to follow, represented by navy blue wave 4. The wave cancel invalid level of 8,049.65 is crucial for validating the current wave structure, and any breach of this level would require a reassessment of the wave count.
Technical Analyst: Malik Awais
Source: visit Tradinglounge.com and learn From the Experts Join TradingLounge Here
See previous:CAC 40 Index Elliott Wave Analysis
Special Trial Offer - 0.76 Cents a Day for 3 Months! Click here
Access 7 Analysts Over 170 Markets Covered. Chat Room With Support