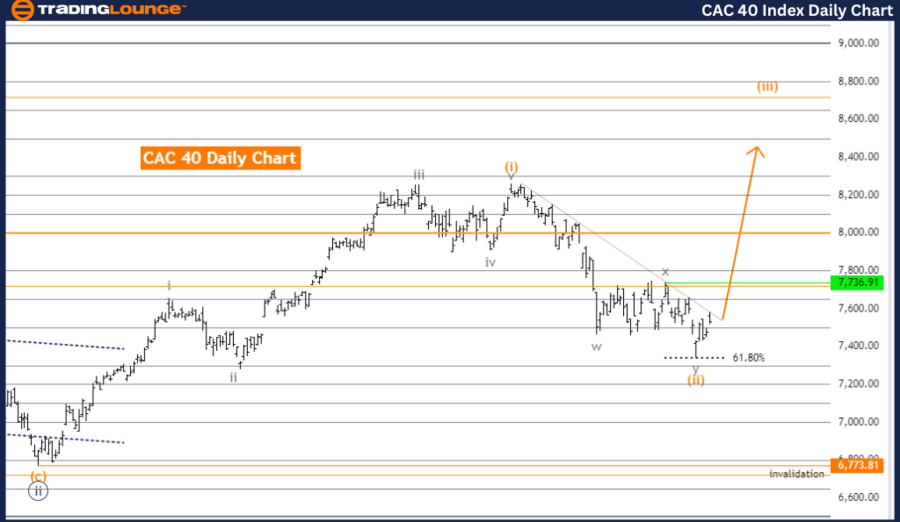
CAC 40 (France) Elliott Wave Analysis - Trading Lounge Day Chart
CAC 40 (France) Daily Chart Analysis
CAC 40 (France) Elliott Wave Technical Analysis
Function: Trend
Mode: Impulsive
Structure: Orange wave 3
Position: Navy Blue Wave 3
Next Higher Degrees Direction: Orange wave 3 (initiated)
Details: The analysis suggests that orange wave 2 has completed, leading to the formation of orange wave 3. The invalidation level for this structure is 6773.81.
The daily chart of CAC 40 shows an impulsive trend function, indicating the presence of orange wave 3 within a larger navy blue wave 3. This structure points to a significant bullish trend continuation.
Technical analysis confirms that orange wave 2 has ended, marking the conclusion of a corrective phase and the beginning of an impulsive phase, represented by orange wave 3. This transition is crucial, signaling a likely continued upward trajectory in the market.
The direction for subsequent higher degrees is indicated as orange wave 3, which has already commenced. This movement is part of a larger impulsive wave sequence, suggesting sustained bullish momentum as the market progresses through the subsequent waves.
The wave invalidation level is established at 6773.81. This threshold is vital for validating the current wave structure. A fall below this level would invalidate the existing wave count, necessitating a reevaluation of the wave structure and overall market outlook.
In summary, the daily Elliott Wave Analysis of CAC 40 indicates an impulsive upward trend within orange wave 3, nested in navy blue wave 3. The completion of orange wave 2 marks the end of the corrective phase and the initiation of the impulsive phase with orange wave 3 active. The critical invalidation level of 6773.81 serves as a key validation point for the current wave structure, requiring reassessment if breached.
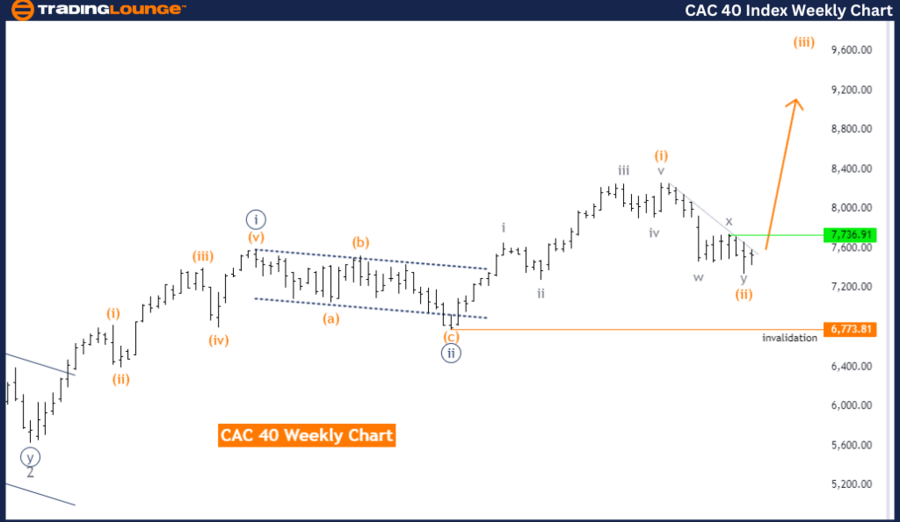
CAC 40 (France) Elliott Wave Analysis - Trading Lounge Weekly Chart
CAC 40 (France) Weekly Chart Analysis
CAC 40 (France) Elliott Wave Technical Analysis
Function: Trend
Mode: Impulsive
Structure: Orange wave 3
Position: Navy Blue Wave 3
Next Higher Degrees Direction: Orange wave 3 (initiated)
Details: The analysis suggests that orange wave 2 has concluded, transitioning to orange wave 3. The invalidation level for this wave structure is 6773.81.
The weekly chart of CAC 40 displays an impulsive trend function, with the current wave structure identified as orange wave 3 within a broader navy blue wave 3. This formation signals a strong bullish trend and ongoing upward momentum.
According to the technical analysis, the completion of orange wave 2 signifies the end of a corrective phase and the start of a new impulsive phase, marked by orange wave 3. This transition is pivotal, confirming the likelihood of an upward trend in the market.
The direction for the next higher degrees is designated as orange wave 3, which has already started. This movement is part of a larger impulsive wave sequence, indicating sustained bullish momentum as the market moves through the subsequent waves.
The wave invalidation level is set at 6773.81. This level is critical for validating the current wave structure. If CAC 40 falls below this level, the present wave count would be invalidated, indicating that the expected wave pattern may no longer be applicable, requiring a reevaluation of the wave structure and market outlook.
In summary, the Elliott Wave Analysis of CAC 40 on the weekly chart suggests the index is currently in an impulsive upward trend within orange wave 3, positioned within navy blue wave 3. The completion of orange wave 2 marks the end of the corrective phase and the initiation of a new impulsive phase, with orange wave 3 now in play. The invalidation level of 6773.81 is crucial for verifying the current wave structure, necessitating reassessment if breached.
Technical Analyst: Malik Awais
Source: visit Tradinglounge.com and learn From the Experts Join TradingLounge Here
See previous:Swiss Market Index Elliott Wave Analysis
Special Trial Offer - 0.76 Cents a Day for 3 Months! Click here
Access 7 Analysts Over 170 Markets Covered. Chat Room With Support