25Mar

KOSPI Composite Index Elliott Wave Technical Analysis: Bullish Wave 3 Forecast & Trading Strategy for South Korea’s Stock Market

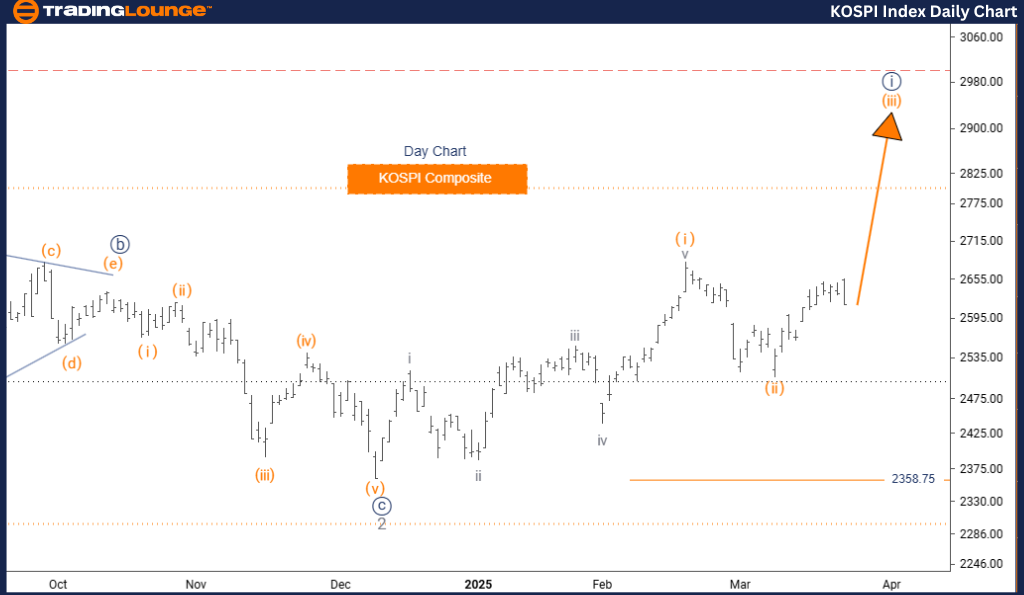
KOSPI Composite Elliott Wave Analysis Trading Lounge Day Chart

KOSPI Composite Index Day Chart Analysis

KOSPI Composite Wave Technical Analysis

Function: Bullish Trend

Mode: Impulsive

Structure: Orange Wave 3

Position: Navy Blue Wave 1

Next Higher Degree Direction: Orange Wave 3 (Started)

Wave Cancel Invalid Level: 2,358.75

The daily Elliott Wave analysis of the KOSPI Composite Index presents a bullish outlook for South Korea's primary stock market index. The wave pattern is impulsive, emphasizing the ongoing Orange Wave 3, positioned within Navy Blue Wave 1 at a higher degree. Completion of Orange Wave 2 suggests a transition into a new upward cycle, reinforcing the continuation of bullish momentum.

Orange Wave 3 usually indicates sustained and expansive price advances, matching the present technical setup. The critical invalidation level stands at 2,358.75; a drop below this figure would challenge the current Elliott Wave count.

With Orange Wave 3 likely in motion, price action and trading volume should be closely watched for signals typical of impulsive wave behavior. The chart structure provides a firm base for short-to-intermediate term bullish strategies. Understanding wave degrees is vital for aligning with the dominant trend, particularly in accelerating markets.

Current wave positioning favors bullish entries, with attention on the invalidation threshold to manage potential risk.

KOSPI-Composite-Inde...


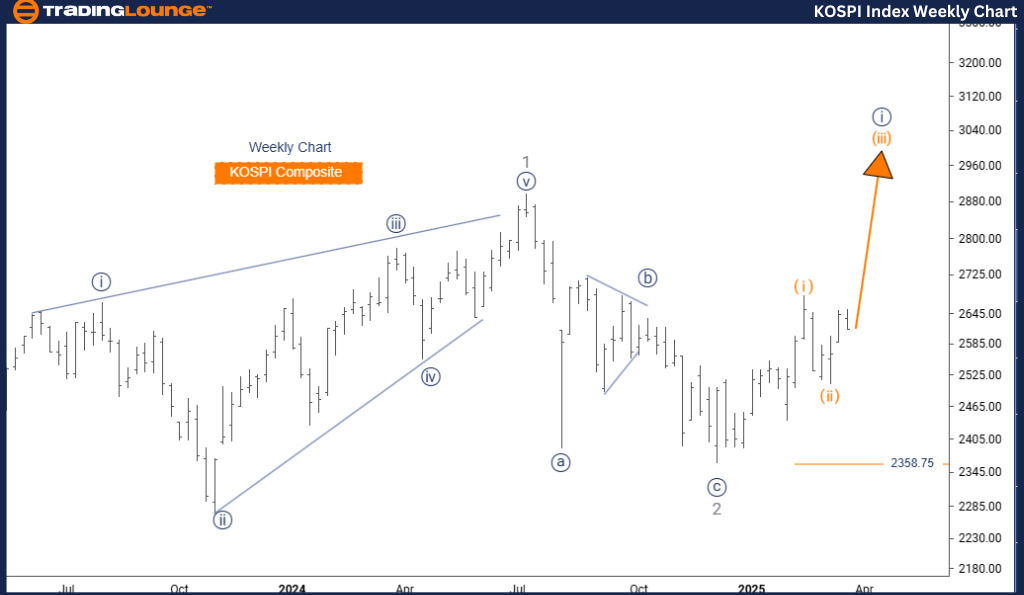
KOSPI Composite – Elliott Wave Analysis Trading Lounge Weekly Chart

KOSPI Composite Wave Technical Analysis

Function: Bullish Trend

Mode: Impulsive

Structure: Orange Wave 3

Position: Navy Blue Wave 1

Next Higher Degree Direction: Orange Wave 3 (Started)

Wave Cancel Invalid Level: 2,358.75

The weekly Elliott Wave outlook for the KOSPI Composite Index remains firmly bullish. The index continues its upward move within an impulsive framework, now progressing through Orange Wave 3 under the larger umbrella of Navy Blue Wave 1.

Following the expected conclusion of Orange Wave 2, the index appears to have started a new rally leg. This third wave phase is known for robust price momentum, which aligns with the ongoing positive trend. The 2,358.75 level remains the invalidation marker—falling beneath it would disrupt the current wave expectation.

Given the weekly timeframe, this analysis supports long-term bullish strategies, providing clarity for traders and investors aiming to align with macro-level market movements. Volume and price acceleration should serve as key indicators for validating the strength of Orange Wave 3.

This structure illustrates a longer-term growth phase, giving traders a tactical advantage within the broader bullish market environment. The trend remains intact, with risk closely tied to the invalidation level.

Technical Analyst: Malik Awais

Source: visit Tradinglounge.com and learn From the Experts Join TradingLounge Here 

Previous: S&P 500 Elliott Wave Technical Analysis

VALUE Offer - Buy 1 Month & Get 3 Months!Click here

Access 7 Analysts Over 200 Markets Covered. Chat Room With Support

KOSPI-Composite-Inde...

Related

BLOCK, INC - XYZ (SQ2) Elliott Wave Analysis & Elliott Wave Technical Chart Predicts Bullish Target with Key Support Holding

BLOCK, INC - XYZ (SQ2) Elliott Wave Analysis & Elliott Wave Technical Chart Predicts Bullish Target with Key Support Holding

This article provides a complete Elliott Wave analysis for ASX: BLOCK INC - SQ2, highlighting a bull...

Read More >
Hang Seng Index Elliott Wave Analysis: HSI Market Outlook, Bullish Trend, Trading Strategy, Price Prediction & Technical Insights

Hang Seng Index Elliott Wave Analysis: HSI Market Outlook, Bullish Trend, Trading Strategy, Price Prediction & Technical Insights

Hang Seng Index Elliott Wave analysis provides an in-depth HSI market outlook, focusing on wave stru...

Read More >
Elliott Wave analysis for Meta Platforms Inc. (META) Stock, Covering both Daily and 4-hour charts Technical Analysis

Elliott Wave analysis for Meta Platforms Inc. (META) Stock, Covering both Daily and 4-hour charts Technical Analysis

This article provides a detailed Elliott Wave analysis for Meta Platforms Inc. (META), covering both...

Read More >
Elliott Wave Analysis: Major Indices Poised for Potential Upswings Amid Key Economic Data Releases

Elliott Wave Analysis: Major Indices Poised for Potential Upswings Amid Key Economic Data Releases

S&P 500 (SPX): The Wave ii) low may be established, but confirmation is needed through a completed u...

Read More >
ASX BHP GROUP LIMITED Elliott Wave Analysis & Technical Forecast: Clear Wave 3 Targets with Invalidation for Bullish Trade Setup

ASX BHP GROUP LIMITED Elliott Wave Analysis & Technical Forecast: Clear Wave 3 Targets with Invalidation for Bullish Trade Setup

BHP on ASX appears to complete wave 2 via Zigzag correction, now entering wave 3. Targets lie betwee...

Read More >
Comprehensive UnitedHealth Group Inc. (UNH) Stock Analysis: Elliott Wave Insights, Technical Forecast, and Trading Strategies

Comprehensive UnitedHealth Group Inc. (UNH) Stock Analysis: Elliott Wave Insights, Technical Forecast, and Trading Strategies

Dive into detailed Elliott Wave analysis for UNH stock, uncovering trend patterns, corrective moveme...

Read More >

$1 for 2 Weeks

then $29 a month!

What a Special Offer!

Trade Recommendations

Unleash the power of deversified trading with our comprehensive portfolio, covering 250+ markets:

  • Stock Trades
  • Crypto Trades
  • Forex Trades
  • Commodity Trades
Elliott Wave Analysis

Gain a competitive edge with expert insights and AI-powered Elliott Wave charting into:

  • Global Indices
  • US Stocks & ASX Stocks
  • Forex & Crypto
  • Commodities
Top-Notch Trading Tools

Equip yourself with the tools of success:

  • Real-time Chat rooms
  • Elliott Wave Algorithm
  • Portfolio tools
  • TradingLevels
  • Screener
  • Trading Game
7 Elliott Wave Analysts

Stay ahead of the market with daily charts and insightful videos
Your secret to strategic trading!

JOIN HERE


Welcome to TradingLounge (ASIC A.R.No. 321187), specialists in trades, trading education and technical analysis, covering stocks, indices, commodities, forex and cryptocurrencies.

When you join TradingLounge you have access to everything we offer, including trade tools, educational content and a social platform to chat with like-minded investors.

Read more

@Copyright 2024 by tradinglounge.com

Contact Us

Australian no: 02 4787 6020

International no: +61 (2) 47876020

Pay with:

Find us on