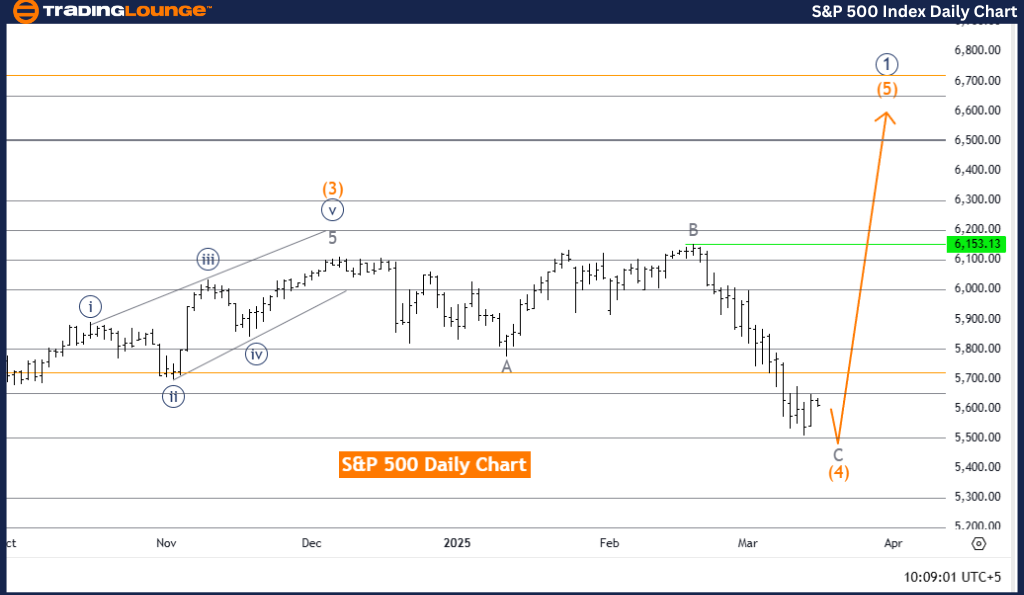
S&P 500 Elliott Wave Analysis – Trading Lounge Daily Chart
S&P 500 Elliott Wave Technical Analysis
Function: Counter Trend
Mode: Corrective
Structure: Orange Wave 4
Position: Navy Blue Wave 1
Next Higher Degree Direction: Orange Wave 5
Detailed Market Analysis
The S&P 500 Elliott Wave Analysis on the daily chart offers an in-depth perspective on the index’s current trend and its likely future direction.
- The market remains in a counter-trend phase, indicating corrective price action rather than a strong directional movement.
- The primary focus is Orange Wave 4, part of an ongoing correction within the broader Elliott Wave structure.
- This wave is positioned within Navy Blue Wave 1, defining its place in the long-term wave count.
- Following the completion of Orange Wave 3, the market has now entered Orange Wave 4, a phase typically characterized by sideways movement or retracements before resuming its main trend.
- Analysis suggests Orange Wave 4 is nearing completion, which signals the potential beginning of Orange Wave 5.
- The next key phase to monitor is Orange Wave 5, expected to initiate once Orange Wave 4 concludes.
- Traders should closely track Orange Wave 4’s evolution and be prepared for the transition into Orange Wave 5, which could bring renewed market momentum.
Market Insights & Trading Strategy
The S&P 500 daily chart analysis provides a structured approach to identifying key Elliott Wave patterns, helping traders anticipate market shifts and align their strategies effectively.
- Analyzing the daily chart allows traders to identify critical trend shifts, ensuring alignment with longer-term market movements.
- Recognizing wave transitions enables traders to prepare for potential entry and exit points, optimizing their trading strategies.
- Understanding the completion of one wave and the emergence of another allows for better risk management and position sizing.
- By integrating Elliott Wave principles, traders can develop a more structured trading approach, ensuring readiness for evolving market dynamics.
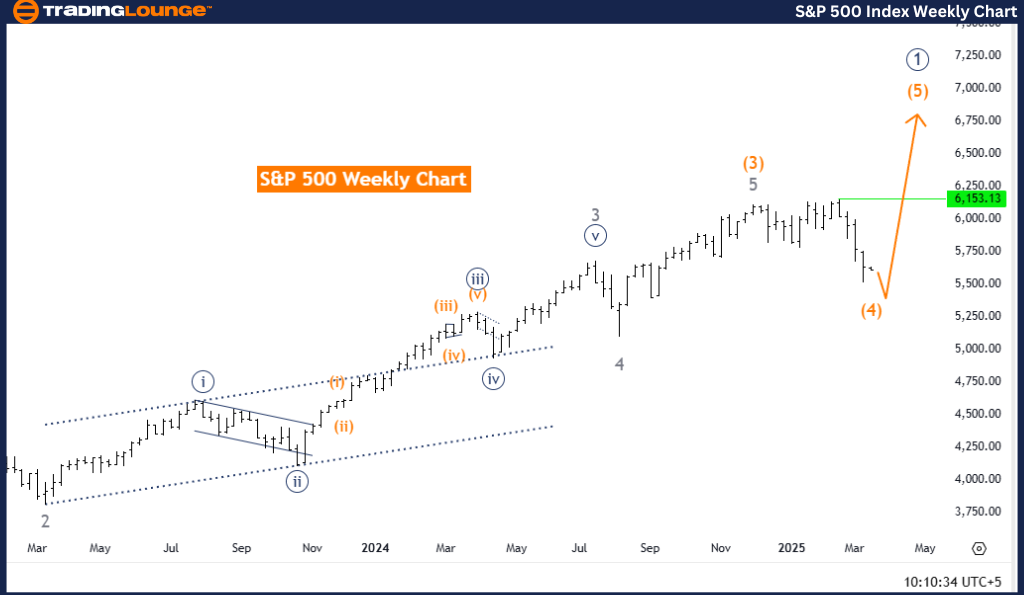
S&P 500 Elliott Wave Analysis – Trading Lounge Weekly Chart
S&P 500 Elliott Wave Technical Analysis
Function: Counter Trend
Mode: Corrective
Structure: Orange Wave 4
Position: Navy Blue Wave 1
Next Higher Degree Direction: Orange Wave 5
Detailed Market Analysis
The S&P 500 Elliott Wave Analysis on the weekly chart offers a broader perspective on the index’s market cycle, helping traders identify major trend shifts and long-term opportunities.
- The market remains in a counter-trend phase, dominated by corrective movements.
- Orange Wave 4 continues to unfold within Navy Blue Wave 1, reinforcing its place in the larger wave count.
- With Orange Wave 3 completed, the market is now transitioning into Orange Wave 4, a phase typically marked by sideways consolidation or retracements before a new trend emerges.
- Orange Wave 4 is approaching its final stages, suggesting Orange Wave 5 may soon begin.
- Traders should monitor the final developments of Orange Wave 4 and prepare for a potential shift into Orange Wave 5, which could bring renewed bullish momentum.
Market Insights & Trading Strategy
This S&P 500 weekly chart analysis provides traders with long-term insights into market cycles, allowing them to make strategic adjustments based on Elliott Wave principles.
- The weekly chart gives a macro-level perspective, helping traders identify major trend shifts and key reversal points.
- Recognizing Elliott Wave structures aids in understanding when corrective waves conclude and impulse waves resume, allowing for better trade execution.
- Adapting strategies to align with Elliott Wave projections can lead to improved risk management and market positioning.
Technical Analyst: Malik Awais
Source: Visit Tradinglounge.com and learn from the Experts. Join TradingLounge Here
Previous: S&P/TSX 60 Elliott Wave Technical Analysis
VALUE Offer - Buy 1 Month & Get 3 Months!Click here
Access 7 Analysts Over 200 Markets Covered. Chat Room With Support