Elliott Wave Analysis of Bitcoin (BTCUSD): Navigating Current Market Trends
The Elliott Wave Theory is a potent tool in the arsenal of traders who seek to understand and predict market patterns, especially in highly volatile markets like that of Bitcoin against the U.S. dollar (BTCUSD). Today, we explore the current positioning and potential future movements of BTCUSD through detailed Elliott Wave Analysis.
Bitcoin/ U.S. dollar(BTCUSD) Daily Chart Analysis
BTCUSD Elliott Wave Technical Analysis
Understanding the Current Elliott Wave Structure Currently, Bitcoin exhibits a complex market structure that can be decoded using the Elliott Wave Principle. This principle helps traders identify extreme points in investor psychology, represented through waves, which signal potential shifts in market direction.
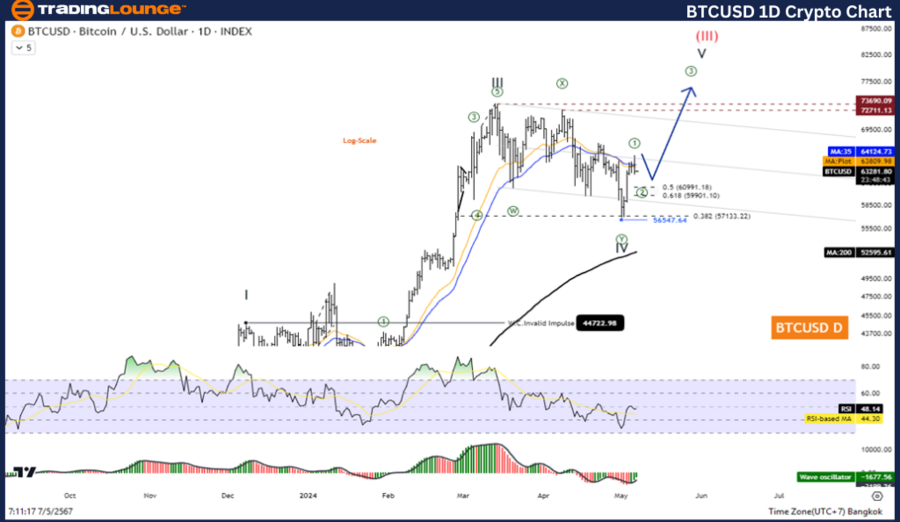
Technical Analysis: Daily Chart Overview
- Function and Mode: BTCUSD is in a counter-trend mode, characterized as corrective.
- Structure: The market structure is identified as flat.
- Current Position: The price is positioned at Wave ((C)).
- Projected Direction: Looking ahead, we anticipate movement towards Wave (III).
- Critical Invalid Level: A pivotal point to watch is 31,046.25, beyond which the current wave count becomes invalid.
Details on Market Movements: Wave IV of the Elliott Wave sequence may have reached its completion, indicating that a resurgence in price could occur, leading into Wave V. This marks a significant phase where traders might see an increase in market activity and price.
Trading Strategy: Capturing Upcoming Opportunities Bitcoin continues to display strength with its underlying uptrend intact despite undergoing a corrective phase in Wave IV. This correction appears concluded, presenting a strategic opening for traders to re-engage with the bullish trend. Prospective traders should consider positions that capitalize on this expected upward trajectory.
Technical Indicators: Daily Chart Insights
- Moving Average: BTCUSD remains above the 200-day Moving Average (MA200), reinforcing the uptrend scenario.
- Wave Oscillator: Indications from the Wave Oscillator suggest bullish momentum, aligning with the overall positive trend.
BTCUSD Elliott Wave Analysis TradingLounge: H4 Chart Breakdown
Bitcoin/ U.S. dollar(BTCUSD)H4 Chart Analysis
BTCUSD Elliott Wave Technical Analysis
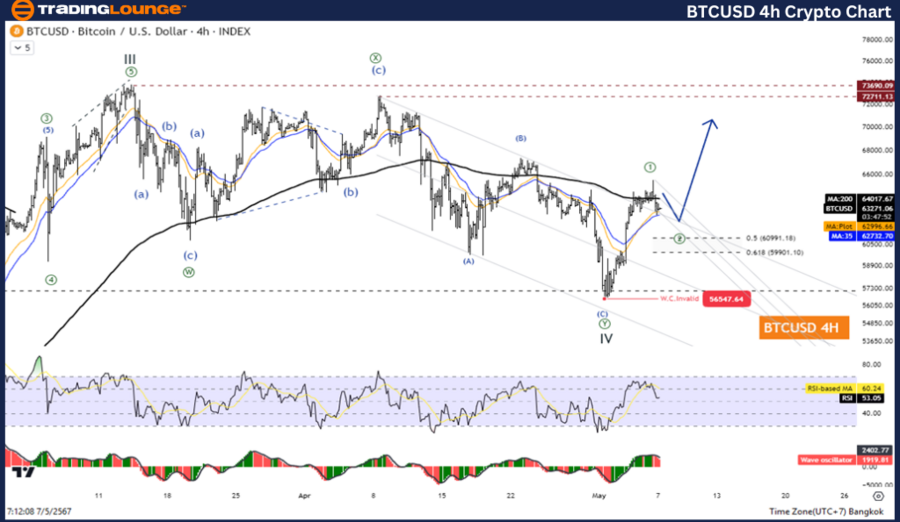
- Function and Mode: The function on this timeframe remains as a counter-trend, and the mode is corrective.
- Structure: The structure is noted as flat.
- Position: The focus is currently on Wave C.
- Future Direction: The trajectory is set towards wave (2).
- Wave Relation: Wave (2) shows a retracement to 61.8% of Wave (1) at a precise level of 61,903.07.
- Critical Invalid Level: The analysis puts the critical invalid level at 59,835.83 for this particular wave.
Trading Strategy: Enhancing Portfolio with Precise Entries Given the completion of the correction phase in the fourth wave, another favorable phase for entering long positions emerges. Traders should stay vigilant and ready to leverage long opportunities presented by the resumed uptrend.
Technical Indicators: H4 Chart Analysis
- Moving Average Status: Staying above the MA200 confirms the sustained bullish sentiment.
- Wave Oscillator: The bullish momentum indicated by the Wave Oscillator on the H4 chart supports the continued positive outlook.
Technical Analyst: Kittiampon Somboonsod
Source: visit Tradinglounge.com and learn From the Experts Join TradingLounge Here
Previous: Elliott Wave Analysis for TRON/US Dollar (TRXUSD)
Special Trial Offer - 0.76 Cents a Day for 3 Months! Click here
Access 6 Analysts covering over 150 Markets. Chat Room With Support
Conclusion The Elliott Wave Analysis for BTCUSD highlights a period ripe with opportunities for traders who understand the nuances of wave patterns. Both the Daily and H4 charts provide compelling evidence of a bullish continuation. Traders are advised to monitor these levels closely and adjust their strategies to align with the unfolding wave patterns, ensuring they are positioned to capitalize on potential market movements.