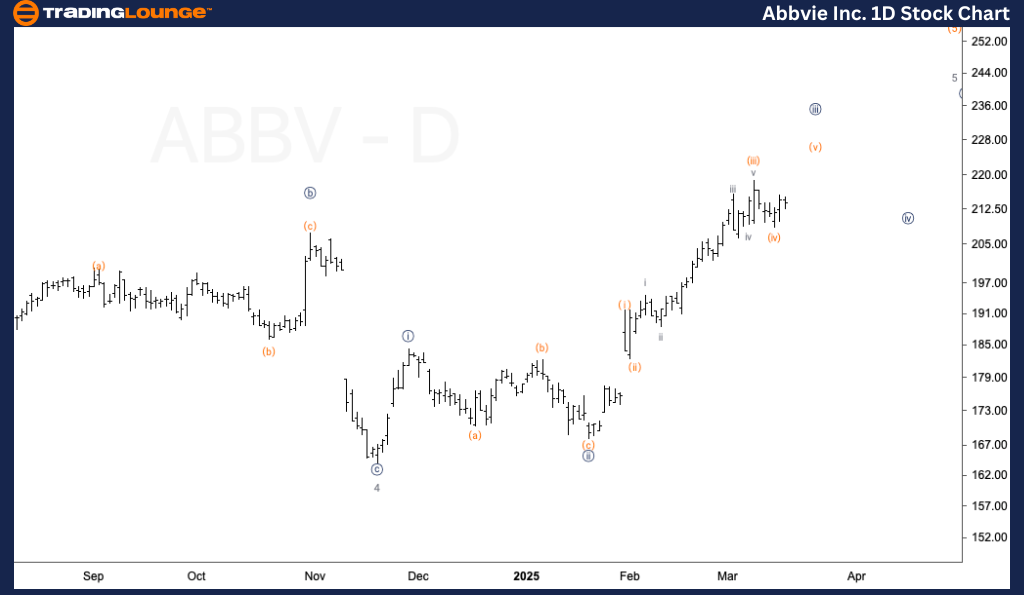
ABBV Elliott Wave Analysis – Trading Lounge Daily Chart
ABBV Elliott Wave Technical Analysis
Function: Trend
Mode: Impulsive
Structure: Motive
Position: Wave {iii} of 5
Direction: Upside in Wave {iii}
Details:
- Expecting further bullish movement to complete Minute Wave {iii}.
- Potential resistance and upside target near $230, marking the completion of MG1.
- Anticipating a corrective Wave {iv} pullback before resumption of the primary uptrend.

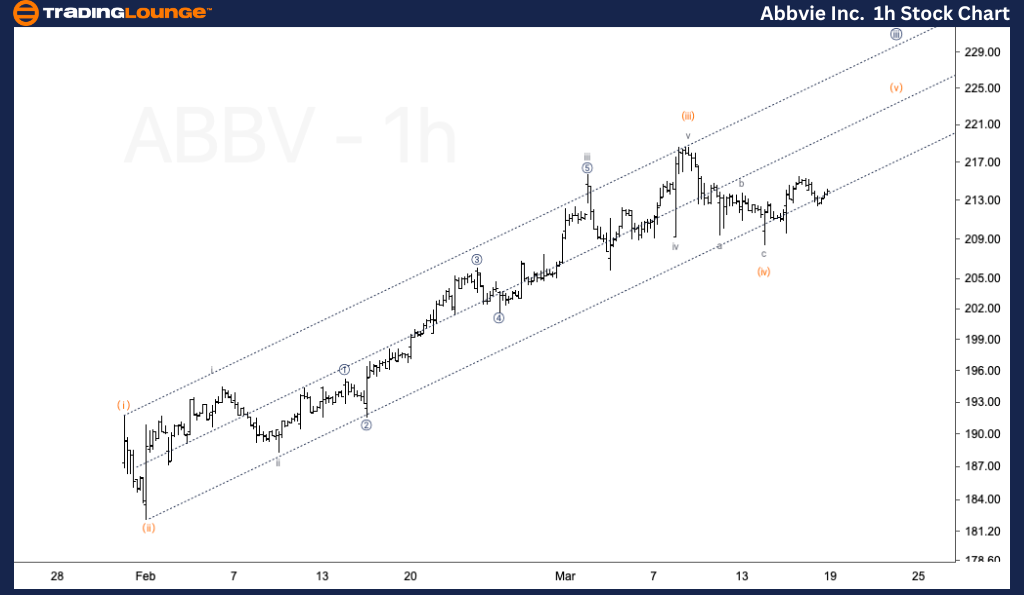
ABBV Elliott Wave Analysis – Trading Lounge 1H Chart
ABBV Elliott Wave Technical Analysis
Function: Trend
Mode: Impulsive
Structure: Motive
Position: Wave (v) of {iii}
Direction: Upside in Wave (v)
Details:
- Currently monitoring a three-wave corrective structure in Minuette Wave (iv).
- Wave (iv) might have completed, with potential upside movement confirming a new Wave (v) rally.
- Further gains in Wave (v) will validate the continuation of Wave {iii}, pushing towards higher price targets.
Technical Analyst: Malik Awais
Source: Visit Tradinglounge.com and learn from the Experts. Join TradingLounge Here
Previous: Alibaba Group Holdings Ltd. (BABA) Elliott Wave Technical Analysis
VALUE Offer - Buy 1 Month & Get 3 Months!Click here
Access 7 Analysts Over 200 Markets Covered. Chat Room With Support

Conclusion
This Elliott Wave forecast outlines potential trend extensions and market corrections. AbbVie (ABBV) is projected to maintain its bullish momentum towards the $230 level, while stocks like CAT, CRM, CVX, and PANW remain in corrective phases, awaiting confirmation of trend reversals or continuations.