Alibaba Group Holdings Ltd. (BABA) Elliott Wave Analysis – Trading Lounge Daily Chart Analysis
BABA Elliott Wave Technical Analysis
Function: Trend
Mode: Impulsive
Structure: Motive
Position: Wave (5) of C
Direction: Upside within wave (5)
Details:
Alibaba (BABA) continues its upward movement within wave (5) of Primary wave C, indicating a long-term corrective phase retracing the 2021 decline. Key resistance is anticipated around $168, where wave C could potentially equal wave A.

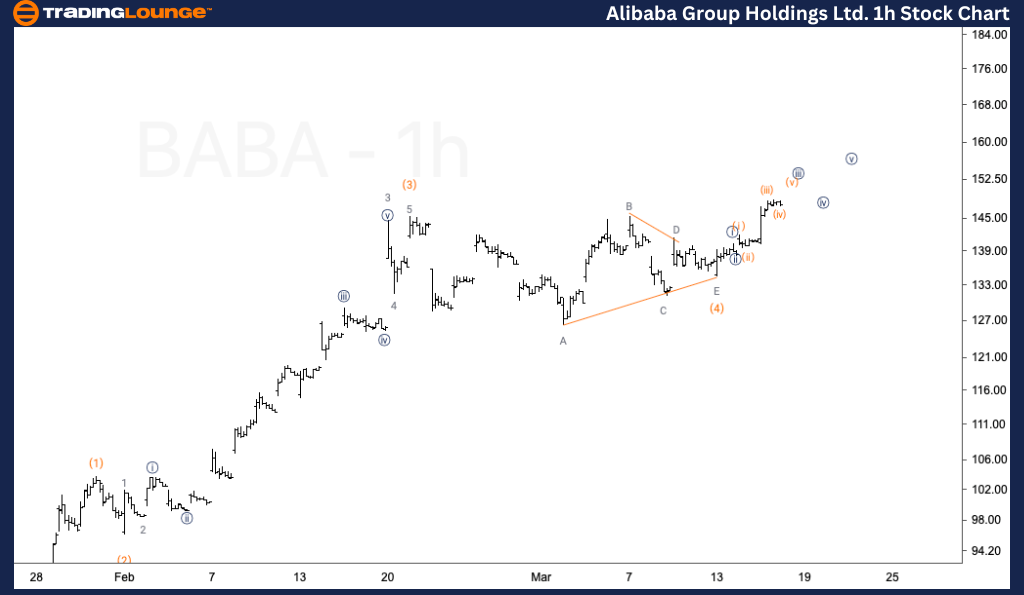
Alibaba Group Holdings Ltd. (BABA) Elliott Wave Analysis – Trading Lounge 1-Hour Chart Analysis
Function: Trend
Mode: Impulsive
Structure: Motive
Position: Wave 1 of (5)
Direction: Upside within wave (5)
Details:
Alibaba remains in an upward trajectory within wave (5), nearing the completion of wave 1 of (5). A wave 2 pullback is expected, offering a critical point to evaluate whether the movement represents wave 1 of (5) or marks the end of wave (5). With resistance approaching, upside potential may be limited in the near term.
Technical Analyst: Malik Awais
Source: Visit Tradinglounge.com and learn from the Experts. Join TradingLounge Here
Previous: MSFT Elliott Wave Technical Analysis
VALUE Offer - Buy 1 Month & Get 3 Months!Click here
Access 7 Analysts Over 200 Markets Covered. Chat Room With Support

Conclusion
This Elliott Wave analysis assesses trend structures across financial markets, identifying potential resistance and retracement levels. For Alibaba (BABA), the key focus remains on wave (5), with $168 as a crucial resistance level that could define the completion of the corrective rally.