17Mar

Microsoft Inc. (MSFT) Elliott Wave Analysis: Stock Forecast, Price Prediction & Market Trends for Bullish or Bearish Reversal

Microsoft Inc. (MSFT) Elliott Wave Analysis – Trading Lounge Daily Chart

MSFT Elliott Wave Technical Analysis

Function: Counter Trend

Mode: Corrective

Structure: ZigZag

Position: Wave {iv} of C

Direction: Downside in wave C

Details:

A three-wave pattern is forming in Intermediate wave (2), with wave C of (2) nearing completion. However, wave {v} of C remains unconfirmed, indicating the corrective phase is still active. Once wave C finalizes, traders should watch for a potential trend reversal or new impulsive wave, signaling a shift in market momentum.

Microsoft-Inc-1d-sto...


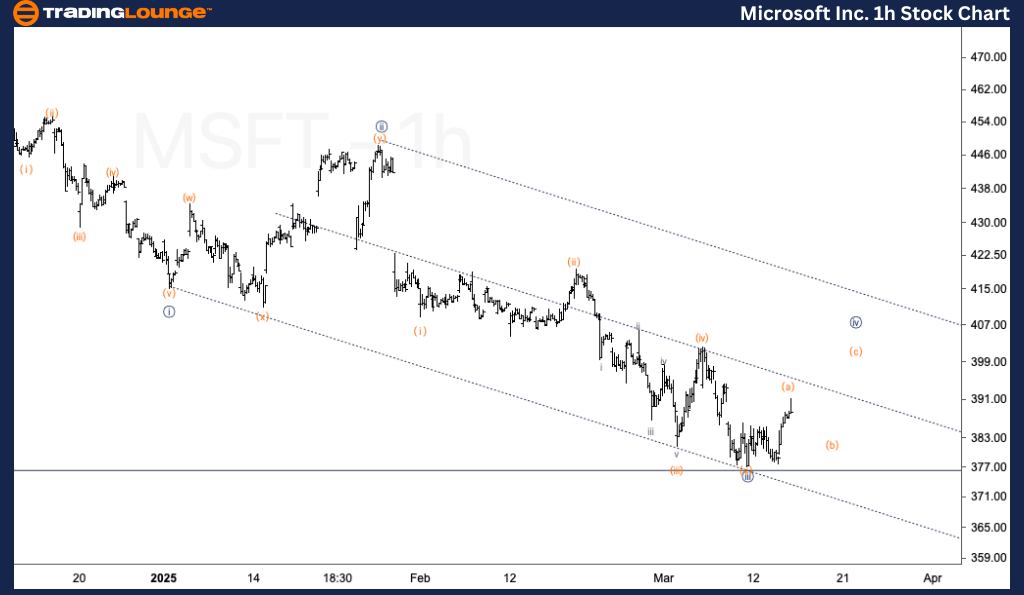
MSFT Elliott Wave Technical Analysis – Trading Lounge 1H Chart

Function: Counter Trend

Mode: Corrective

Structure: ZigZag

Position: Wave {iv} of C

Direction: Near Completion in wave {iv}

Details:

An upward correction is emerging in Minute wave {iv}, with the market progressing higher in wave (a) of {iv}. Expectations lean towards further upside movement; however, resistance is anticipated near $400. Any breakout above this level could invalidate the current Elliott Wave structure, necessitating a reassessment of the corrective phase.

Technical Analyst: Malik Awais

Source: Visit Tradinglounge.com and learn from the Experts. Join TradingLounge Here 

Previous: Berkshire Hathaway Inc. (BRK.B) Elliott Wave Technical Analysis

VALUE Offer - Buy 1 Month & Get 3 Months!Click here

Access 7 Analysts Over 200 Markets Covered. Chat Room With Support

Microsoft-Inc-1h-sto...


Market Insights & Trading Strategy

This Elliott Wave analysis for Microsoft Inc. (MSFT) evaluates both daily and 1-hour timeframes, leveraging Elliott Wave Theory to assess current market trends and forecast potential price movements.


By monitoring key support and resistance levels, traders can refine their strategies and anticipate significant price shifts. The conclusion of wave C's corrective structure may set the stage for a bullish reversal or new impulsive wave, while the development of wave {iv} in the 1H chart is crucial for short-term trading decisions.

Related

NEO Crypto Price News Today Elliott Wave Technical Analysis of NEO/USD: Comprehensive Trading Insights

NEO Crypto Price News Today Elliott Wave Technical Analysis of NEO/USD: Comprehensive Trading Insights

This article provides a detailed Elliott Wave analysis of NEO against the U.S. dollar (NEOUSD), offe...

Read More >
Tron Crypto Price News Today Elliott Wave Technical Analysis for Tron (TRXUSD): Daily and H4 Chart Overview

Tron Crypto Price News Today Elliott Wave Technical Analysis for Tron (TRXUSD): Daily and H4 Chart Overview

This article provides an in-depth Elliott Wave analysis of the TRXUSD trading pair, focusing on the ...

Read More >
Cocoa Elliott Wave Technical Analysis: Breaking into New Highs Signals Strong Bullish Momentum

Cocoa Elliott Wave Technical Analysis: Breaking into New Highs Signals Strong Bullish Momentum

Cocoa's price action reflects a strong bullish sentiment, supported by analyses across daily and...

Read More >
Elliott Wave Predicts Key Turning Points for S&P 500 and Major Indices Amid Economic Indicators

Elliott Wave Predicts Key Turning Points for S&P 500 and Major Indices Amid Economic Indicators

This comprehensive market analysis provides insightful predictions and strategies for navigating the...

Read More >
Asx Stock's Potential Movement Stay Updated with our NWS Stock Analysis & Elliott Wave Technical Forecast

Asx Stock's Potential Movement Stay Updated with our NWS Stock Analysis & Elliott Wave Technical Forecast

Our detailed Elliott Wave analysis on ASX: News Corporation (NWS) provides a comprehensive outlook o...

Read More >
Wheat Commodity Elliott Wave Technical Analysis Indicates the End of a Long-term Bearish Cycle and an Upcoming Bullish Correction

Wheat Commodity Elliott Wave Technical Analysis Indicates the End of a Long-term Bearish Cycle and an Upcoming Bullish Correction

Elliott Wave analysis of wheat prices indicates the end of a long-term bearish cycle and an upcoming...

Read More >

$1 for 2 Weeks

then $29 a month!

What a Special Offer!

Trade Recommendations

Unleash the power of deversified trading with our comprehensive portfolio, covering 250+ markets:

  • Stock Trades
  • Crypto Trades
  • Forex Trades
  • Commodity Trades
Elliott Wave Analysis

Gain a competitive edge with expert insights and AI-powered Elliott Wave charting into:

  • Global Indices
  • US Stocks & ASX Stocks
  • Forex & Crypto
  • Commodities
Top-Notch Trading Tools

Equip yourself with the tools of success:

  • Real-time Chat rooms
  • Elliott Wave Algorithm
  • Portfolio tools
  • TradingLevels
  • Screener
  • Trading Game
7 Elliott Wave Analysts

Stay ahead of the market with daily charts and insightful videos
Your secret to strategic trading!

JOIN HERE


Welcome to TradingLounge (ASIC A.R.No. 321187), specialists in trades, trading education and technical analysis, covering stocks, indices, commodities, forex and cryptocurrencies.

When you join TradingLounge you have access to everything we offer, including trade tools, educational content and a social platform to chat with like-minded investors.

Read more

@Copyright 2024 by tradinglounge.com

Contact Us

Australian no: 02 4787 6020

International no: +61 (2) 47876020

Pay with:

Find us on