GRASIM INDUSTRIES Elliott Wave Analysis | TradingLounge Daily Chart
Grasim Industries Stock Daily Chart Analysis
GRASIM INDUSTRIES Elliott Wave Technical Analysis
FUNCTION: Trend
MODE: Impulsive
STRUCTURE: Navy Blue Wave 3
POSITION: Gray Wave 1
DIRECTION NEXT LOWER DEGREES: Navy Blue Wave 4
DETAILS: Navy blue wave 2 appears completed. Now navy blue wave 3 of 1 is developing.
Invalidation Level: 2463
GRASIM INDUSTRIES is currently displaying a strong impulsive uptrend on the daily chart, confirming the development of Navy Blue Wave 3 within the larger Gray Wave 1 structure. With Navy Blue Wave 2 now likely completed, the price action has transitioned into the most dynamic stage of the Elliott Wave cycle—Wave 3—typically characterized by strong bullish momentum and sharp rallies.
Wave 3, known for producing the longest and most powerful moves in Elliott Wave theory, often reflects heightened market participation and confidence. This transition signals a high-probability phase for sustained upside, offering ideal conditions for trend-trading strategies.
The key invalidation level to watch remains at 2463. A break below this point would negate the current wave count and call for a reassessment of the bullish outlook. This level supports the wave 2 low and acts as a technical anchor for the current wave structure.
From an Elliott Wave forecasting perspective, the next expected movement will be a corrective pullback via Navy Blue Wave 4 following the completion of Wave 3. Until then, traders can anticipate continued strength in the uptrend, supported by favorable momentum indicators and volume expansion.
The daily timeframe serves as a strategic guide for short- to mid-term traders. Observing wave characteristics such as expanding volume and accelerated price action will be essential in confirming the continued progress of Wave 3. Staying above 2463 maintains the bullish structure intact and suggests potential for further price appreciation.

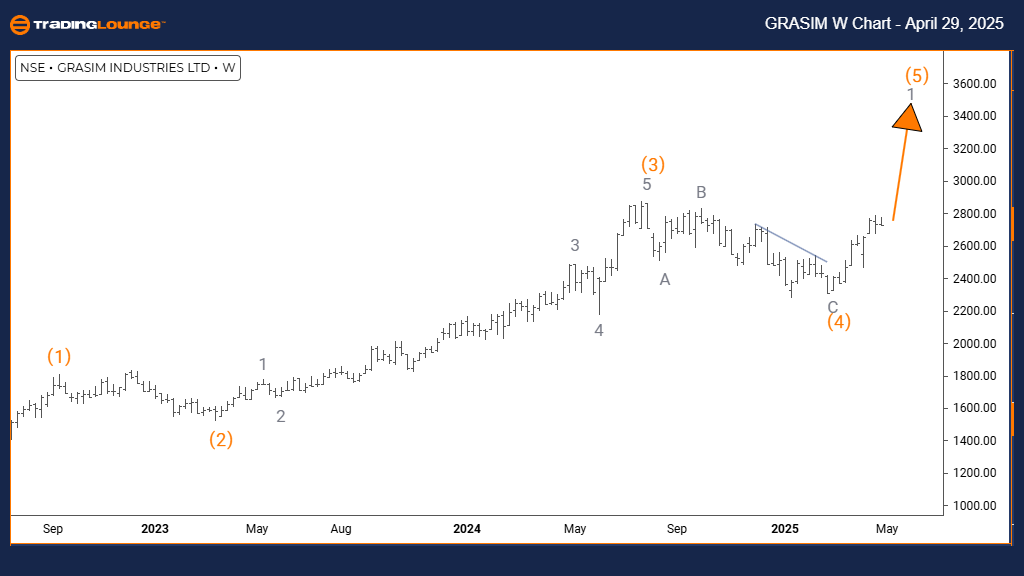
GRASIM INDUSTRIES Elliott Wave Analysis | TradingLounge Weekly Chart
GRASIM INDUSTRIES – Elliott Wave Technical Analysis
FUNCTION: Trend
MODE: Impulsive
STRUCTURE: Gray Wave 1
POSITION: Orange Wave 5
DIRECTION NEXT HIGHER DEGREES: Gray Wave 1 (Started)
DETAILS: Orange wave 4 appears completed. Now gray wave 1 of 5 is in development.
On the weekly chart, GRASIM INDUSTRIES shows a maturing bullish Elliott Wave cycle, advancing through the early stages of Gray Wave 1 within the final Orange Wave 5. The completion of Orange Wave 4 signals a renewed upward phase, typically representing the final thrust of a major impulsive structure.
Gray Wave 1, starting from this base, is expected to carry the market higher, potentially marking the final opportunity to participate in the current broader uptrend before a larger corrective cycle begins. Traders should anticipate firm price action and improving volume metrics as key signs of this wave's health.
The Elliott Wave pattern suggests that this upward push could unfold with a strong and sustained trend. Technical traders should monitor Gray Wave 1 for reliable continuation signals, including bullish candles, volume breakouts, and trend-following indicator alignment.
This phase offers a strategic window for positioning ahead of the potential climax of the broader impulse structure. However, caution is warranted as Orange Wave 5 matures, potentially increasing the risk of volatility and eventual trend reversal. Observing momentum divergences or weakening price action can help flag the upcoming end of the cycle.
Overall, the weekly timeframe highlights an important wave sequence within Elliott Wave theory, suggesting that GRASIM INDUSTRIES remains in a favorable position for bullish medium-term trades. As Gray Wave 1 develops, maintaining awareness of market dynamics will be crucial for capturing the final stages of this trend.
Technical Analyst: Malik Awais
Source: Visit Tradinglounge.com and learn from the Experts. Join TradingLounge Here
Previous: ADANI PORTS & SEZ Elliott Wave Technical Analysis
VALUE Offer - Buy 1 Month & Get 3 Months!Click here
Access 7 Analysts Over 200 Markets Covered. Chat Room With Support