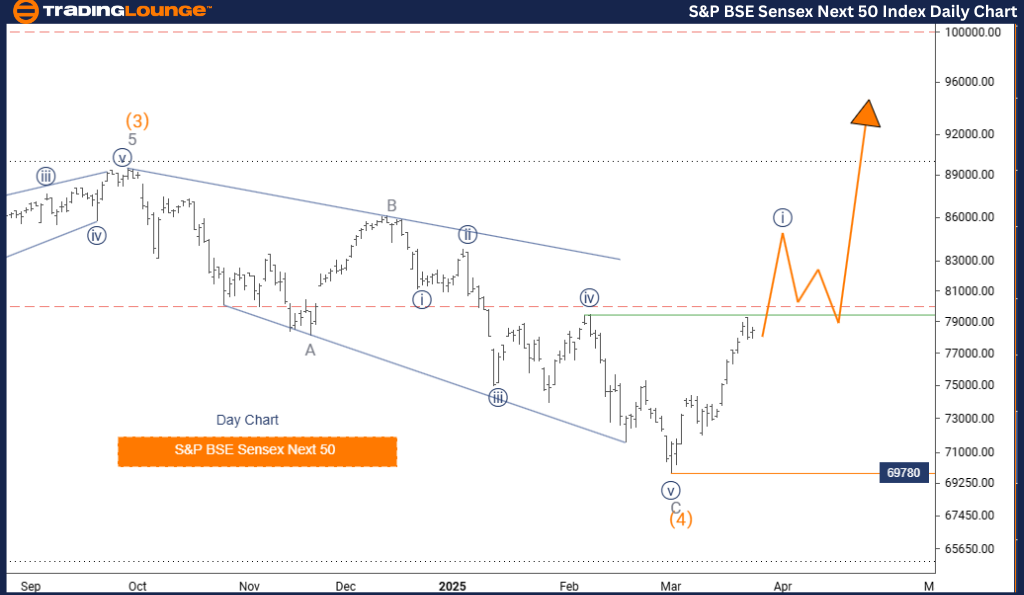
S&P BSE Sensex (India) – Elliott Wave Analysis – TradingLounge Day Chart
S&P BSE Sensex – Elliott Wave Technical Analysis
Function: Bullish Trend
Mode: Impulsive
Structure: Navy Blue Wave 1
Position: Gray Wave 1
Direction Next Lower Degrees: Navy Blue Wave 2
Wave Cancel Invalid Level: 69780
The daily Elliott Wave forecast for the S&P BSE Sensex highlights a bullish momentum pattern unfolding in India’s leading stock index. The index has entered a new impulsive phase, driven by the emergence of navy blue wave 1, representing the early segment of the larger gray wave 1 cycle.
As navy blue wave 1 progresses within gray wave 1, it signals the beginning of a long-term upward move. The critical Elliott Wave invalidation level is identified at 69780—a decline beneath this would invalidate the current bullish scenario.
After the completion of navy blue wave 1, a corrective pullback into navy blue wave 2 is anticipated, likely to be followed by a renewed uptrend. The daily chart gives traders clarity on both the short-term structure and its placement within the broader wave context.
Market indicators such as increasing volume and rising momentum support the impulsive wave structure, suggesting a continuation of the bullish trend. This wave setup lays the foundation for an extended advance under gray wave 1.
Traders should confirm the wave count through supporting technical indicators and price action. Effective risk management near the 69780 mark remains essential. This analysis serves as a tactical guide for investors seeking to position early in a potential long-term bullish movement in the Indian stock market.
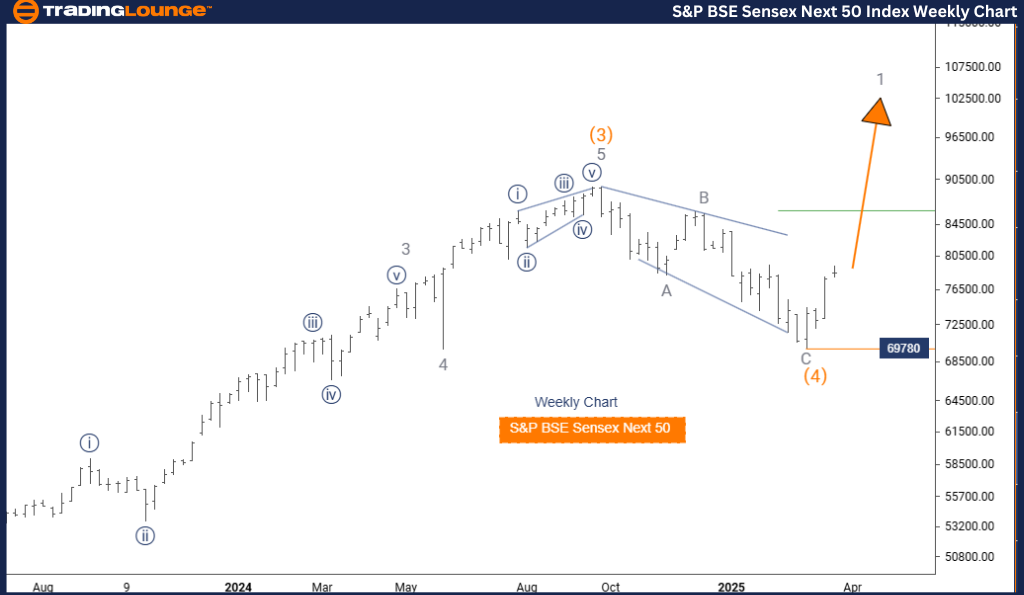
S&P BSE Sensex (India) – Elliott Wave Analysis – TradingLounge Weekly Chart
S&P BSE Sensex – Elliott Wave Technical Analysis
Function: Bullish Trend
Mode: Impulsive
Structure: Gray Wave 1
Position: Orange Wave 5
Direction Next Higher Degrees: Gray Wave 1 (started)
Wave Cancel Invalid Level: 69780
The weekly Elliott Wave analysis of the S&P BSE Sensex projects a strong bullish outlook for the Indian equities market. The index is currently advancing through gray wave 1, which initiates the final impulsive sequence under orange wave 5.
Technical analysis confirms that the corrective structure of orange wave 4 has concluded, paving the way for an impulsive rally in gray wave 1 of 5. This scenario aligns with the early stages of a multi-week or multi-month upward cycle.
The pivotal invalidation level is placed at 69780. Any price movement below this level would dispute the present Elliott Wave count. From a broader perspective, the weekly chart provides context for the role of gray wave 1 within the full span of orange wave 5.
Traders and investors should watch for increasing volume, strong upward momentum, and extended price trends—hallmarks of an unfolding impulsive wave. This pattern supports long-term bullish positioning.
With gray wave 1 representing both a tactical entry point and a structural element of the larger trend, traders are urged to align their strategies accordingly. Relying on technical confirmation and ensuring protective stops near 69780 enhances risk-adjusted exposure.
This weekly Elliott Wave perspective is instrumental for market participants aiming to capture opportunities in the broader upward trend of the Indian stock market.
Technical Analyst: Malik Awais
Source: visit Tradinglounge.com and learn From the Experts Join TradingLounge Here
Previous: KOSPI Composite Elliott Wave Technical Analysis
VALUE Offer - Buy 1 Month & Get 3 Months!Click here
Access 7 Analysts Over 200 Markets Covered. Chat Room With Support