USDCAD Elliott Wave Analysis - Trading Lounge Daily Chart
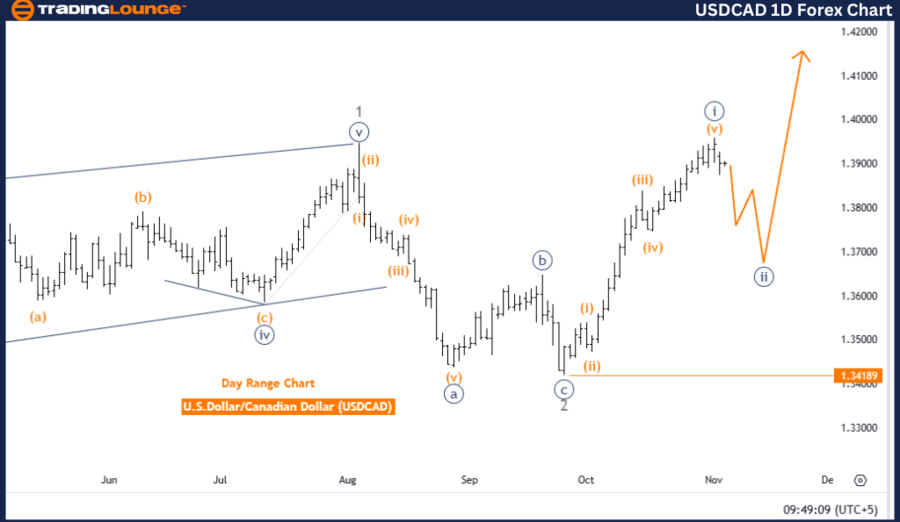
U.S. Dollar / Canadian Dollar (USDCAD) – Daily Chart Analysis
USDCAD Elliott Wave Technical Analysis
Function: Counter Trend
Mode: Corrective
Structure: Navy blue wave 2
Position: Gray wave 1
Next Higher Degree Direction: Navy blue wave 3
Details: Navy blue wave 1 has likely completed, and navy blue wave 2 is now in progress.
Wave Cancel Invalid Level: 1.34189
Analysis Summary
The daily Elliott Wave analysis for the USD/CAD pair indicates a counter-trend corrective structure focused on navy blue wave 2. This suggests a short-term consolidation phase, following the completion of navy blue wave 1, leading to the current retracement within navy blue wave 2. Such phases often involve pullbacks or consolidation, allowing the price to stabilize before resuming the primary trend. This setup positions the market within a potential consolidation period, after which it may move upward in line with the broader trend.
Current Position
Currently, USDCAD is within gray wave 1, marking the onset of navy blue wave 2. The analysis suggests a corrective phase may bring temporary sideways or downward movement. Upon completion of navy blue wave 2, an upward movement is expected to align with the larger trend, progressing into navy blue wave 3.
Key Level – Wave Cancel Invalid Level
The invalidation level for this wave setup is set at 1.34189. A drop below this threshold would invalidate the current wave structure, signaling a potential trend shift or an extended corrective phase. Conversely, maintaining a price above this level would support the ongoing Elliott Wave configuration, indicating navy blue wave 2 is likely to conclude, setting the stage for a move into navy blue wave 3.
This daily analysis highlights that USDCAD remains in a counter-trend phase with navy blue wave 2 active. If the price holds above 1.34189, the corrective structure is expected to end, potentially paving the way for a continuation of the primary bullish trend into navy blue wave 3.
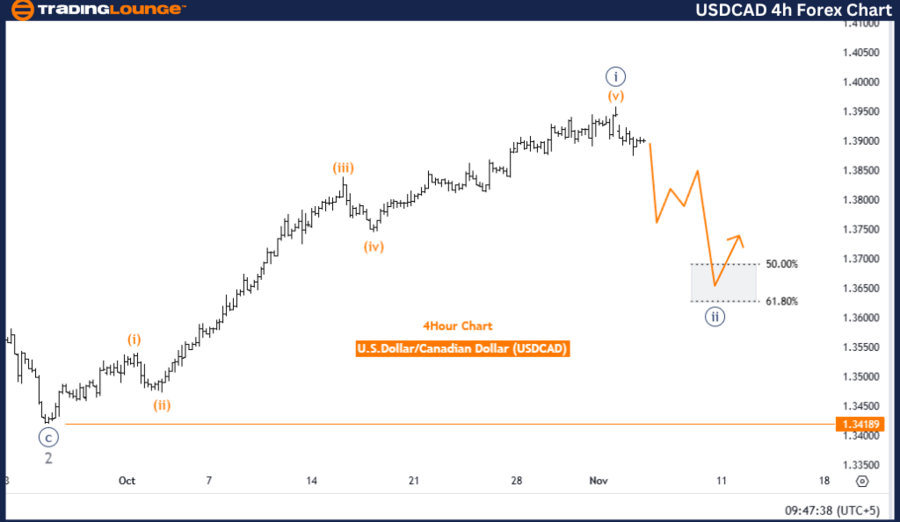
U.S. Dollar / Canadian Dollar (USDCAD) – 4-Hour Chart Analysis
USDCAD Elliott Wave Technical Analysis
Function: Counter Trend
Mode: Corrective
Structure: Navy blue wave 2
Position: Gray wave 1
Next Higher Degree Direction: Navy blue wave 3
Details: Navy blue wave 1 has likely completed, with navy blue wave 2 currently progressing.
Wave Cancel Invalid Level: 1.34189
Analysis Summary
The 4-hour Elliott Wave analysis for USDCAD reveals a counter-trend corrective structure focused on navy blue wave 2. Following the end of navy blue wave 1, the market has entered a retracement phase. Currently positioned within gray wave 1, the chart shows signs of temporary consolidation, consistent with counter-trend movement.
Current Structure
During this corrective phase, navy blue wave 2 appears to be in progress, allowing for short-term adjustments before a potential resumption of the primary upward trend toward navy blue wave 3. According to Elliott Wave principles, corrective waves like navy blue wave 2 typically pause or retrace, helping reset momentum for the next trend phase. This corrective nature implies possible consolidation, potentially leading to an upward shift aligned with the primary trend.
Key Level – Wave Cancel Invalid Level
The invalidation level for the wave pattern stands at 1.34189. If the price dips below this point, it would invalidate the existing wave structure, hinting at a possible alteration in the anticipated wave pattern. Maintaining price above this level supports the corrective pattern, indicating navy blue wave 2 will likely conclude, leading to a continuation into navy blue wave 3. This invalidation threshold provides a critical reference for evaluating possible price movement in this timeframe.
In summary, the 4-hour analysis suggests that navy blue wave 2 marks a retracement within a larger upward trend for USDCAD. Should the price remain above the 1.34189 level, this corrective phase is expected to conclude, likely leading to renewed upward momentum in line with the overall trend toward navy blue wave 3.
Technical Analyst: Malik Awais
Source: visit Tradinglounge.com and learn From the Experts Join TradingLounge Here
Previous: USDCHF Elliott Wave Technical Analysis
VALUE Offer - Buy 1 Month & Get 3 Months!Click here
Access 7 Analysts Over 200 Markets Covered. Chat Room With Support