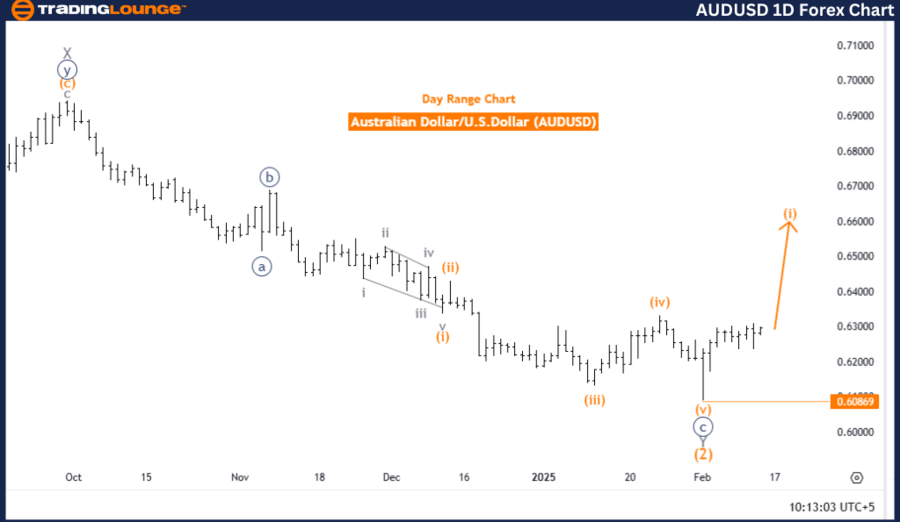
Australian Dollar/U.S. Dollar (AUDUSD) Daily Chart
AUDUSD Elliott Wave Technical Analysis
Function: Bullish Trend
Mode: Impulsive
Structure: Orange Wave 1
Position: Navy Blue Wave 1
Direction Next Lower Degrees: Orange Wave 2
Invalidation Level: 0.60869
Market Overview
The AUDUSD daily chart indicates a strong bullish trend, with an impulsive wave pattern developing. The market is currently advancing in orange wave 1, forming the initial phase of a broader navy blue wave 1. This structure suggests that the Australian Dollar is at the onset of a larger bullish cycle, with momentum supporting higher price action.
The positioning of orange wave 1 within navy blue wave 1 highlights the emergence of a long-term uptrend, driven by solid buying pressure. With previous corrective waves now completed, the market has established a foundation for continued gains.
The next anticipated move is orange wave 2, a corrective phase likely to unfold before the uptrend resumes. Despite the potential for a temporary pullback, the dominant trend remains bullish, supported by Elliott Wave analysis.
Key Level to Watch
- Invalidation Level: 0.60869
A price decline below 0.60869 could negate the current bullish setup. However, as long as the market sustains levels above this threshold, the bullish outlook remains intact, with further upside potential expected.
Summary
- The AUDUSD daily chart remains bullish, with orange wave 1 developing within navy blue wave 1, confirming a new uptrend.
- The invalidation level at 0.60869 is crucial; prices above this level validate the bullish scenario.
- Orange wave 2 is the next anticipated phase, potentially introducing a brief correction before the bullish momentum continues.
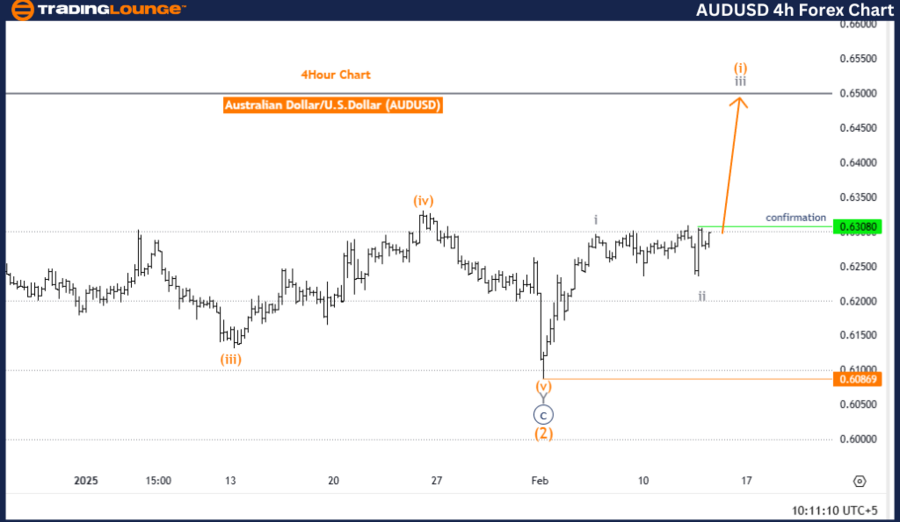
Australian Dollar/U.S. Dollar (AUDUSD) 4-Hour Chart
AUDUSD Elliott Wave Technical Analysis
Function: Bullish Trend
Mode: Impulsive
Structure: Gray Wave 3
Position: Orange Wave 1
Direction Next Higher Degrees: Gray Wave 3 (Started)
Invalidation Level: 0.60869
Market Overview
The AUDUSD 4-hour chart reinforces a bullish outlook, with gray wave 3 now in progress following the completion of gray wave 2 within orange wave 1. This development confirms sustained upward momentum, signaling continued strength in the Australian Dollar.
The conclusion of gray wave 2 marked the end of a corrective phase, giving way to a new impulsive structure. With gray wave 3 now active, the market is displaying strong buying interest, often associated with extended price increases.
The higher-degree wave alignment with gray wave 3 further supports the bullish continuation, indicating that the market is still in the early stages of a larger uptrend. As price action unfolds, the structure suggests further appreciation in the AUDUSD pair.
Key Level to Watch
- Invalidation Level: 0.60869
A decline below 0.60869 could challenge the current bullish setup. However, as long as price holds above this level, the bullish trend remains intact, with expectations for continued upside.
Summary
- The AUDUSD 4-hour chart remains bullish, with gray wave 3 confirming ongoing upward momentum.
- The invalidation level at 0.60869 serves as a crucial support threshold for the bullish scenario.
- The overall Elliott Wave structure supports further gains in the AUDUSD, with gray wave 3 driving the uptrend.
Technical Analyst: Malik Awais
Source: visit Tradinglounge.com and learn From the Experts Join TradingLounge Here
Previous: EURUSD Elliott Wave Technical Analysis
VALUE Offer - Buy 1 Month & Get 3 Months!Click here
Access 7 Analysts Over 200 Markets Covered. Chat Room With Support