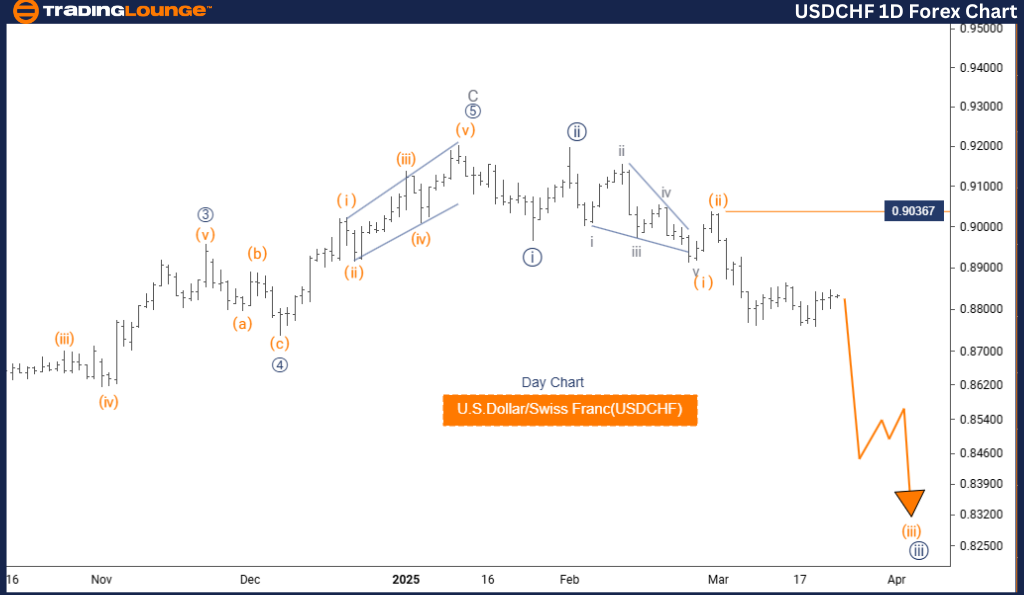
USDCHF Elliott Wave Analysis – Trading Lounge Day Chart
U.S. Dollar / Swiss Franc (USDCHF) – Day Chart Analysis
USDCHF Elliott Wave Technical Analysis
Function: Bearish Trend
Mode: Impulsive
Structure: Orange Wave 3
Position: Navy Blue Wave 3
Next Higher Degree Direction: Continuation of Orange Wave 3
Wave Cancel Invalid Level: 0.90367
The USDCHF Elliott Wave analysis on the daily timeframe reveals a strong bearish trend supported by an impulsive wave structure. The key focus is on orange wave 3, part of a higher-level formation currently progressing inside navy blue wave 3. This setup suggests continued downside momentum in the coming sessions.
With orange wave 2 likely completed, the price appears to be entering the next phase – orange wave 3 of 3. This segment typically delivers extended downward movement, strengthening the prevailing bearish forex trend. Traders can expect robust downside price action unless invalidation occurs.
The critical resistance and invalidation level is set at 0.90367. A move above this threshold would nullify the current wave structure and potentially signal a change in market direction. Until then, traders should monitor orange wave 3's development for forex trading opportunities within the current Elliott Wave pattern.
This daily analysis helps traders align their strategies with the medium-term USDCHF forecast, providing insights into market momentum and wave structure positioning. Recognizing the relationship between wave degrees enhances the precision of trading setups in trend-driven market conditions.
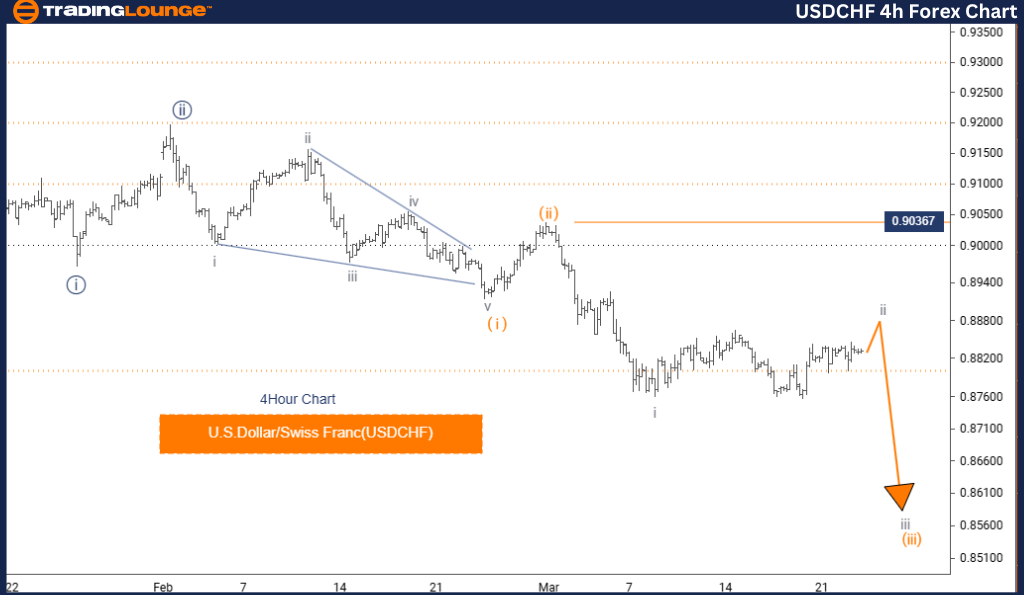
U.S. Dollar / Swiss Franc (USDCHF) – 4 Hour Chart
USDCHF Elliott Wave Technical Analysis
Function: Counter Trend
Mode: Corrective
Structure: Gray Wave 2
Position: Orange Wave 3
Next Lower Degree Direction: Gray Wave 3
Wave Cancel Invalid Level: 0.90367
The USDCHF 4-hour Elliott Wave forecast offers a short-term technical outlook focused on a corrective counter-trend phase. The active wave is gray wave 2, nested within orange wave 3 of the broader impulsive sequence.
Following the completion of gray wave 1, the market has likely transitioned into gray wave 2. This wave is corrective in nature, typically resulting in a retracement or sideways movement. Traders should prepare for the emergence of gray wave 3, which will mark a return to impulsive movement once the correction ends.
The 0.90367 level acts as the invalidation point. A price break above this level could signal a wave structure failure and potential trend reversal. Until then, the current pattern suggests more consolidation before the next directional move.
This 4-hour chart analysis helps traders position themselves ahead of short-term market movements. Understanding wave progression in a corrective setting aids in timing entries and exits, making it easier to adapt to the dynamic nature of forex trading.
Technical Analyst: Malik Awais
Source: Visit Tradinglounge.com and learn from the Experts Join TradingLounge Here
Previous: AUDUSD Elliott Wave Technical Analysis
VALUE Offer - Buy 1 Month & Get 3 Months!Click here
Access 7 Analysts Over 200 Markets Covered. Chat Room With Support