Elliott Wave Analysis for UnitedHealth Group Inc. (UNH)

This detailed Elliott Wave analysis for UnitedHealth Group Inc. (UNH) explores the daily and 1-hour charts, utilizing the principles of Elliott Wave Theory to predict potential future price movements.

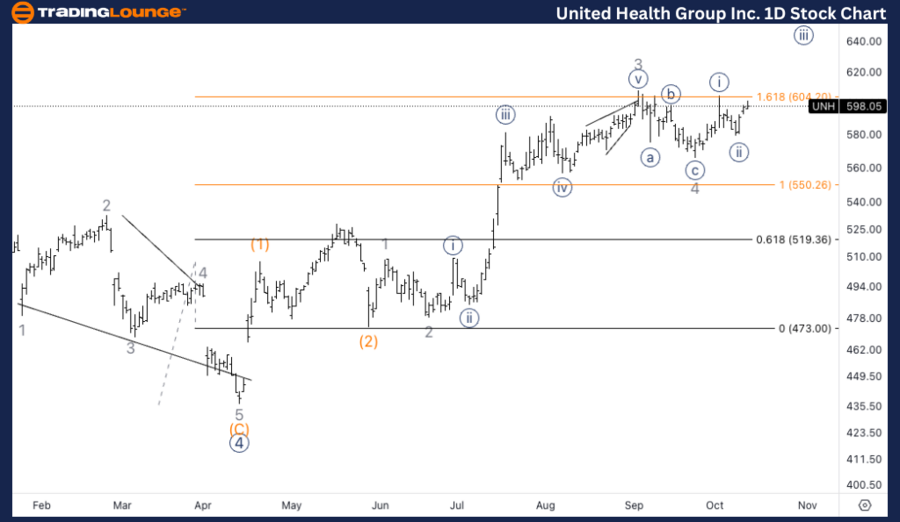
UNH Elliott Wave Analysis - TradingLounge Daily Chart

UnitedHealth Group Inc. (UNH) Daily Chart Overview

UNH Elliott Wave Technical Analysis:

Function: Trend

Mode: Impulsive

Structure: Motive

Position: Minor wave 5

Direction: Upside within wave 3

Key Details: We are closely monitoring wave 4 to see if it has already reached its bottom or is near completion. Once wave 4 confirms its conclusion, we expect further upside movement targeting the MediumLevel of $650.

META Shares Technical Analysis – Daily Chart

According to the daily chart, UNH is likely in the final stages of wave 4 or has already completed it. The next expected move will be Minor wave 5 with an upward push towards $650. The corrective phase (wave 4) is coming to an end, and once confirmed, the continuation of the uptrend should follow. This will solidify the bullish structure towards the anticipated target.

United-Health-Group-...


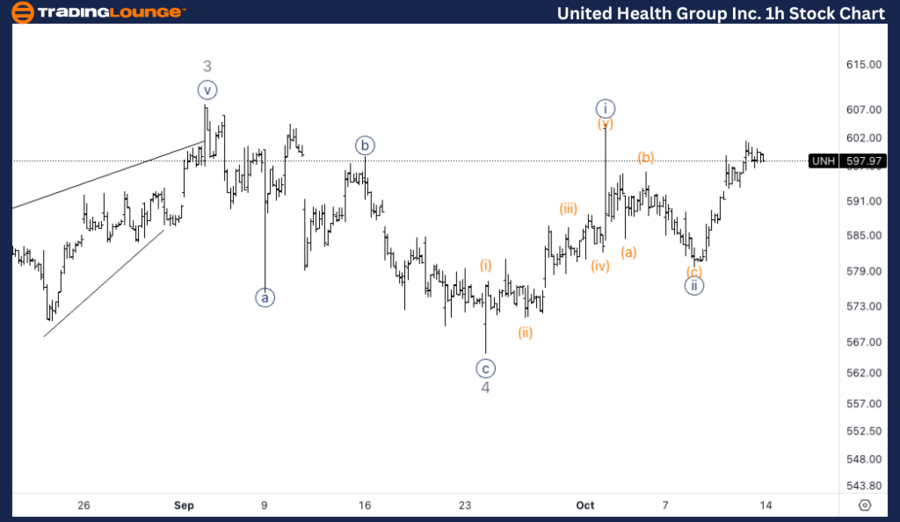
UnitedHealth Group Inc. (UNH) 1-Hour Chart Analysis

UNH Elliott Wave Technical Analysis:

Function: Trend

Mode: Impulsive

Structure: Motive

Position: Minute wave {iii}

Direction: Upside within wave {iii}

Key Details: The 1-hour chart suggests that the stock has completed a five-wave structure within wave {i} of Minor wave 5. The current movement could represent wave {ii}. A critical test will be the establishment of support above the $600 level. Once this support is confirmed, the uptrend should resume, propelling the stock higher into wave {iii}.

META Technical Analysis – 1-Hour Chart

UNH has likely finished the initial wave {i} of Minor wave 5, with wave {ii} currently unfolding. The key focus now is on testing support at $600. A successful test at this level would confirm the resumption of the bullish trend into wave {iii}, signaling more upside ahead.

Technical Analyst: Alessio Barretta

Source: visit Tradinglounge.com and learn From the Experts Join TradingLounge Here 

See Previous: Avery Dennison Corp. (AVY) Elliott Wave Technical Analysis

VALUE Offer - Buy 1 Month & Get 3 Months!Click here

Access 7 Analysts Over 200 Markets Covered. Chat Room With Support

United-Health-Group-...

Related

U.S.Dollar/Swiss Franc(USDCHF) Elliott Wave Technical Analysis 23 January 24

U.S.Dollar/Swiss Franc(USDCHF) Elliott Wave Technical Analysis 23 January 24

Trading Lounge Day Chart for USDCHF Elliott Wave Analysis dated 23 January 24, delves into the intri...

Read More >
Our detailed U.S.Dollar /Canadian Dollar (USD/CAD) Forex Elliott Wave Technical Analysis: Market Dynamics for this Currency Pair.

Our detailed U.S.Dollar /Canadian Dollar (USD/CAD) Forex Elliott Wave Technical Analysis: Market Dynamics for this Currency Pair.

Our detailed USD/CAD Elliott Wave analysis offers valuable insights into the current market dynamics...

Read More >
EURUSD Elliott Wave Analysis: Bullish Trend, Impulsive Wave Structure & Technical Forecast for Forex Traders

EURUSD Elliott Wave Analysis: Bullish Trend, Impulsive Wave Structure & Technical Forecast for Forex Traders

EURUSD Elliott Wave analysis, highlighting the bullish trend and key levels to watch. The technical ...

Read More >
Gold (XAUUSD) Elliott Wave Technical Analysis

Gold (XAUUSD) Elliott Wave Technical Analysis

Stay ahead in the Gold (XAUUSD) market with our Elliott Wave Technical Analysis for February 14, 202...

Read More >
Bitcoin/U.S. dollar(BTCUSD) Elliott Wave Technical Analysis 17 January 24

Bitcoin/U.S. dollar(BTCUSD) Elliott Wave Technical Analysis 17 January 24

Bitcoin/U.S. dollar(BTCUSD) Elliott Wave Technical Analysis dated 17 January 24 with Bitcoin and U.S...

Read More >
WTI Elliott Wave Technical Analysis: Understanding the Current Trends and Future Projections

WTI Elliott Wave Technical Analysis: Understanding the Current Trends and Future Projections

The WTI crude oil market is currently experiencing a downward trend, as indicated by Elliott Wave an...

Read More >

Buy 1 Month

Get 3 Months!

Special Offer:

Trade Recommendations

Unleash the power of deversified trading with our comprehensive portfolio, covering:

  • Stock Trades
  • Crypto Trades
  • Forex Trades
  • Commodity Trades
Elliott Wave Analysis

Gain a competive edge with expert insights in to:

  • Global Indices
  • US Stocks & ASX Stocks
  • Forex & Crypto
  • Commodities
Top-Notch Trading Tools

Equip yourself with the tools of success:

  • Social Chat
  • Elliott Wave Algorithm
  • Screener
  • TradingLevels
  • Trading Game
7 Elliott Wave Analysts

Stay ahead of the market with daily charts and insightful videos
-Your secret to strategic trading!

JOIN HERE


Welcome to TradingLounge (ASIC A.R.No. 321187), specialists in trades, trading education and technical analysis, covering stocks, indices, commodities, forex and cryptocurrencies.

When you join TradingLounge you have access to everything we offer, including trade tools, educational content and a social platform to chat with like-minded investors.

Read more

@Copyright 2024 by tradinglounge.com

Contact Us

Australian no: 02 4787 6020

International no: +61 (2) 47876020

Pay with:

Find us on