WiseTech Global Limited (WTC) Elliott Wave Technical Analysis on 1D and 4-Hour Charts

Introduction to WiseTech's Stock Movement through Elliott Wave Theory

Elliott Wave analysis provides a framework for understanding stock price movements through recurring wave patterns. In this update, we focus on WiseTech Global Limited (ASX: WTC), highlighting its bullish momentum in the Australian Stock Exchange (ASX) as seen in both the daily and 4-hour chart analyses.

Daily Chart Elliott Wave Analysis of WiseTech Global (WTC)

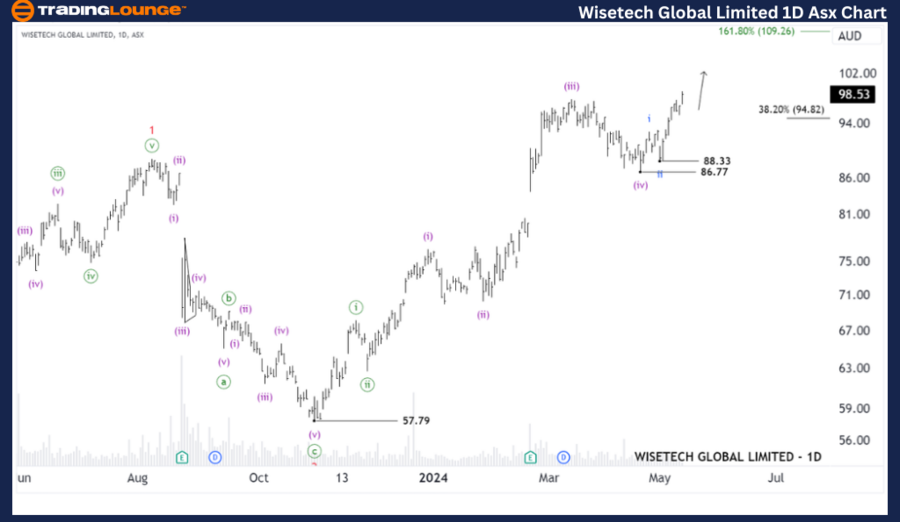
Function: Tracking Major Trends (Minute Degree, Green)

Mode: Motive (Directional Movement)

Structure: Impulse (Strong Price Movement)

Position: In the middle of Wave iii-blue, within Wave (v)-purple of Wave ((iii))-green

Key Observations: Last week’s predictions have materialized as anticipated, with WTC's price trajectory aligning perfectly with our forecasts. Currently, WiseTech’s stock exhibits a strong impulse wave, suggesting continued bullish trends.

Short-Term Outlook:
The recent completion of the (iv)-purple wave sets the stage for the unfolding of wave (v)-purple. This wave aims to elevate the stock's price, targeting a high of 109.26. For this bullish scenario to remain valid, it is essential for WTC’s stock price to sustain above 94.82.

Invalidation Point:
A drop below 88.33 could negate the current bullish forecast, suggesting a reassessment of the wave count.

Wisetech-Global-ltd-...


4-Hour Chart Elliott Wave Analysis of WiseTech Global (WTC)

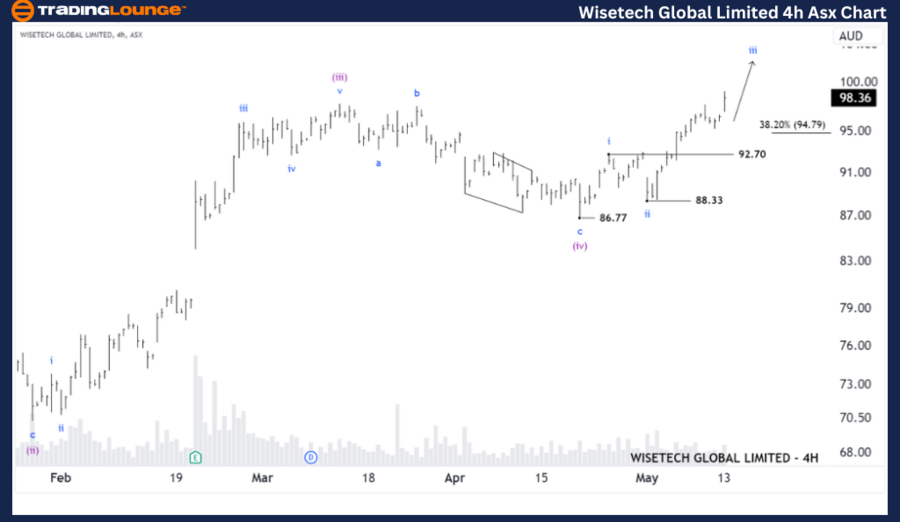
Function: Analysis of Major Trends (Subminuette Degree, Blue)

Mode: Motive

Structure: Impulse

Position: Currently in Wave iii-blue

Detailed Analysis:
The shorter-term 4-hour chart supports the bullish view shown in the daily analysis, with Wave iii-blue actively driving prices higher. The critical level to watch is 94.79; staying above this price confirms the bullish momentum.

Future Movements:
Should the stock price remain above 94.79, it is poised to continue its ascent. However, a dip below this level could indicate the beginning of wave iv-blue, which might lead to a minor correction before wave v-blue propels the price upward again.

Invalidation Point:
Similar to the daily chart, the bullish outlook will be invalidated if the price falls below 88.33.

Technical Analyst: Hua (Shane) Cuong, CEWA-M (Master’s Designation)

Source: visit Tradinglounge.com and learn From the Experts Join TradingLounge Here 

Previous: ASX Fortescue Metals Group Ltd

Special Trial Offer - 0.76 Cents a Day for 3 Months! Click here

Access 7 Analysts Over 170 Markets Covered. Chat Room With Support

Wisetech-Global-ltd-...

Conclusion and Forecast for WiseTech Global Limited (WTC)

The Elliott Wave analysis for WiseTech Global highlights a consistent bullish trend with potential for further price increases. Investors should monitor the support levels closely to ensure they remain within the bullish framework set by the Elliott Wave structure. As WTC progresses through these waves, staying informed on potential shifts in wave patterns can provide strategic insights for trading decisions.

Related

U.S. Dollar / Canadian Dollar (USDCAD) Elliott Wave Technical Analysis & Forecast: Wave Count Insights, Market Trends for Forex Traders

U.S. Dollar / Canadian Dollar (USDCAD) Elliott Wave Technical Analysis & Forecast: Wave Count Insights, Market Trends for Forex Traders

USDCAD Elliott Wave analysis provides an in-depth look at the current market structure, highlighting...

Read More >
Shanghai Composite Index Elliott Wave Technical Analysis - SSE Investment Insights and Shanghai Composite trading

Shanghai Composite Index Elliott Wave Technical Analysis - SSE Investment Insights and Shanghai Composite trading

Gain a deep understanding of Shanghai Composite trading with expert Elliott Wave analysis and action...

Read More >
Detailed insights into Nvidia Corp.(NVDA) Stocks Elliott Wave Technical Analysis Covering daily and 4-hour charts

Detailed insights into Nvidia Corp.(NVDA) Stocks Elliott Wave Technical Analysis Covering daily and 4-hour charts

This article provides an in-depth NVDA Elliott Wave Analysis for Nvidia Corp., covering daily and 4-...

Read More >
Soybean Elliott Wave Technical Analysis: Market Trend Insights, and Bearish Wave Pattern for Soybean Futures Trading

Soybean Elliott Wave Technical Analysis: Market Trend Insights, and Bearish Wave Pattern for Soybean Futures Trading

Soybean Elliott Wave Analysis, offering insights into price trends, wave patterns, and market foreca...

Read More >
Natural Gas Elliott Wave Technical Analysis 12 February 24 Market Trends, Trading Strategies

Natural Gas Elliott Wave Technical Analysis 12 February 24 Market Trends, Trading Strategies

In this comprehensive Natural Gas Elliott Wave Analysis for February 12, traders gain valuable insig...

Read More >
Silver XAGUSD Commodity Elliott Wave Technical Analysis: Covering various aspects of Silver Market

Silver XAGUSD Commodity Elliott Wave Technical Analysis: Covering various aspects of Silver Market

This detailed analysis provides an in-depth look at the silver market, employing Elliott Wave theory...

Read More >

Buy 1 Month

Get 3 Months!

Special Offer:

Trade Recommendations

Unleash the power of deversified trading with our comprehensive portfolio, covering:

  • Stock Trades
  • Crypto Trades
  • Forex Trades
  • Commodity Trades
Elliott Wave Analysis

Gain a competive edge with expert insights in to:

  • Global Indices
  • US Stocks & ASX Stocks
  • Forex & Crypto
  • Commodities
Top-Notch Trading Tools

Equip yourself with the tools of success:

  • Social Chat
  • Elliott Wave Algorithm
  • Screener
  • TradingLevels
  • Trading Game
7 Elliott Wave Analysts

Stay ahead of the market with daily charts and insightful videos
-Your secret to strategic trading!

JOIN HERE


Welcome to TradingLounge (ASIC A.R.No. 321187), specialists in trades, trading education and technical analysis, covering stocks, indices, commodities, forex and cryptocurrencies.

When you join TradingLounge you have access to everything we offer, including trade tools, educational content and a social platform to chat with like-minded investors.

Read more

@Copyright 2024 by tradinglounge.com

Contact Us

Australian no: 02 4787 6020

International no: +61 (2) 47876020

Pay with:

Find us on