02May

NEWMONT CORPORATION - NEM Stock Analysis & Elliott Wave Technical Forecast, Price Targets, & Trading Strategy

ASX: NEWMONT CORPORATION - NEM Elliott Wave Technical Analysis TradingLounge

Greetings, traders!

Today’s Elliott Wave analysis for the Australian Stock Exchange (ASX) spotlights Newmont Corporation (ASX:NEM).
We are tracking ASX:NEM advancing within a powerful third wave, offering key target zones and invalidation levels to guide traders on when the current bullish trend may complete or extend further.


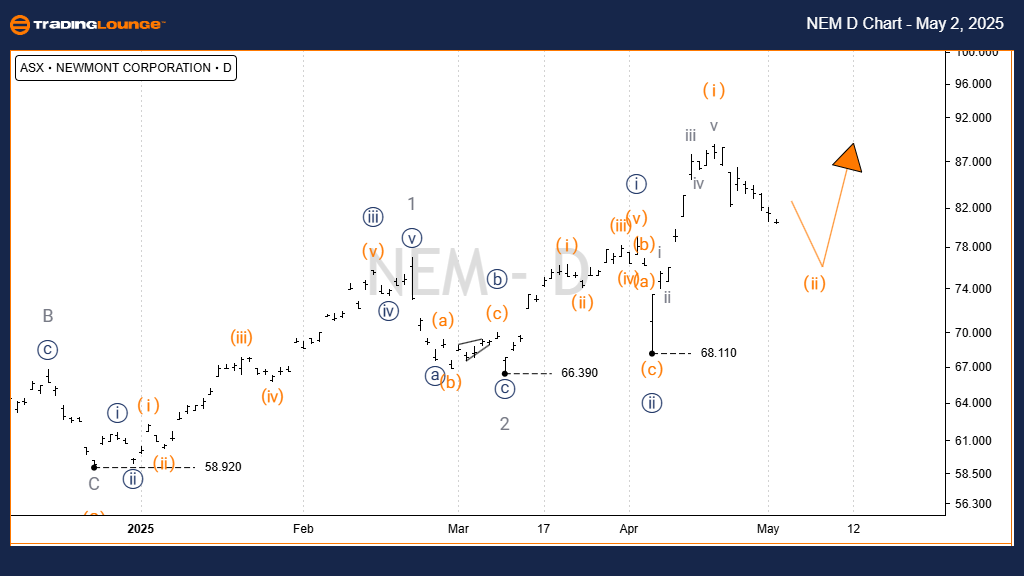
ASX: NEWMONT CORPORATION - NEM Elliott Wave Technical Analysis 1D Chart (Semilog Scale) 

Function: Major trend (Intermediate degree, orange)

Mode: Motive

Structure: Impulse

Position: Wave 3 - grey of Wave (3) - orange

Details:

  • Wave 2 - orange concluded near $58.92.
  • Wave 3 - orange has commenced a new bullish leg, subdividing into wave 1 - grey, wave 2 - grey, and now an ongoing wave 3 - grey.
  • The projected target zone for wave 3 - grey is between $100.00 and $102.37.

Key Invalidation Level: $68.11

NEM-d-chart-asx-0205...


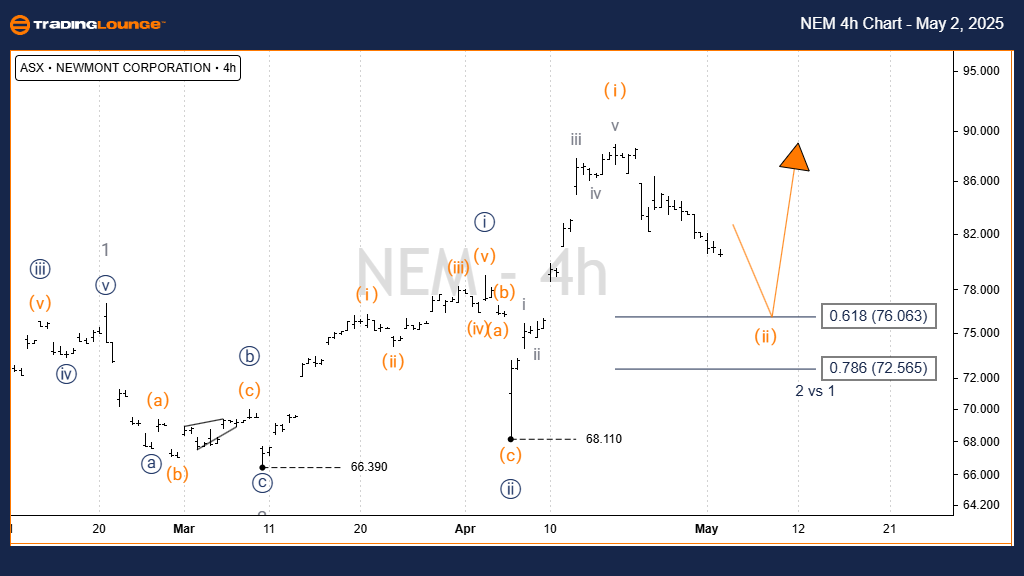
ASX: NEWMONT CORPORATION - NEM Elliott Wave Technical Analysis 4-Hour Chart 

Function: Major trend (Minor degree, grey)

Mode: Motive

Structure: Impulse

Position: Wave ((iii)) - navy of Wave 3 - grey

Details:

  • From the $58.92 low, wave 3 - orange has developed to the upside.
  • The current formation is identified as wave ((iii)) - navy, advancing toward the $102.37 target zone.
  • Price must stay above $68.11 to sustain the bullish Elliott Wave structure.
  • The $79.00 level is crucial: overlapping this point would force a reassessment of the current wave structure.
  • Specifically, wave i) - orange must not be overlapped by wave iv)) - navy to maintain the motive pattern.

Key Invalidation Points: $68.11 and $79.00

Technical Analyst: Hua (Shane) Cuong, CEWA-M (Master’s Designation).

Source: Visit Tradinglounge.com and learn from the Experts. Join TradingLounge Here 

See Previous: COCHLEAR LIMITED - COH Elliott Wave Technical Analysis

VALUE Offer - Buy 1 Month & Get 3 Months!Click here

Access 7 Analysts Over 200 Markets Covered. Chat Room With Support

NEM-4h-chart-asx-020...


Conclusion

This ASX:NEM technical analysis, trend forecast, and trading outlook aim to equip traders with precise and actionable information.
We highlight clear validation and invalidation levels to enhance trading decisions.
By combining detailed Elliott Wave analysis with objective technical strategies, we empower traders to navigate Newmont Corporation’s (ASX:NEM) market movements with professional confidence.

Related

Make Informed Decisions with Accurate British Pound/U.S. Dollar Forex Pair (GBPUSD) Elliott Wave Technical Analysis

Make Informed Decisions with Accurate British Pound/U.S. Dollar Forex Pair (GBPUSD) Elliott Wave Technical Analysis

This in-depth GBPUSD Elliott Wave analysis provides a detailed forecast of the British Pound to US D...

Read More >
ASX: Santos Limited (STO) Stock Analysis & Elliott Wave Technical Forecast with Key Trends and Actionable Trading Strategies

ASX: Santos Limited (STO) Stock Analysis & Elliott Wave Technical Forecast with Key Trends and Actionable Trading Strategies

Get detailed Elliott Wave analysis for ASX: SANTOS LIMITED (STO), including stock trends, price pred...

Read More >
EURGBP Elliott WaveTechnical Analysis: Bearish Trend, Orange Wave 3 Progression, Risk Management Insights, and Forex Trading Strategies

EURGBP Elliott WaveTechnical Analysis: Bearish Trend, Orange Wave 3 Progression, Risk Management Insights, and Forex Trading Strategies

This comprehensive analysis delves into EURGBP Elliott Wave structures, highlighting the ongoing bea...

Read More >
British Pound / Japanese Yen Forex Elliott Wave Technical Analysis: Shows Impulsive Bullish Structure Suggesting More Gains

British Pound / Japanese Yen Forex Elliott Wave Technical Analysis: Shows Impulsive Bullish Structure Suggesting More Gains

This analysis highlights GBPJPY’s current bullish phase within Elliott Wave structure, forecasting ...

Read More >
Unlocking ASX Trading Success: TRANSURBAN GROUP – TCL Stock Analysis & Elliott Wave Technical Forecast

Unlocking ASX Trading Success: TRANSURBAN GROUP – TCL Stock Analysis & Elliott Wave Technical Forecast

The Transurban Group's stock performance (TCL) on the ASX through the lens of Elliott Wave theor...

Read More >
Utilizing both Daily and 4-hour Charts: JP Morgan & Chase Co. (JPM) Stocks Elliott Wave Technical Analysis

Utilizing both Daily and 4-hour Charts: JP Morgan & Chase Co. (JPM) Stocks Elliott Wave Technical Analysis

Our latest Elliott Wave analysis for JP Morgan Chase (JPM) provides comprehensive insights into the ...

Read More >

$1 for 2 Weeks

then $29 a month!

What a Special Offer!

Trade Recommendations

Unleash the power of deversified trading with our comprehensive portfolio, covering 250+ markets:

  • Stock Trades
  • Crypto Trades
  • Forex Trades
  • Commodity Trades
Elliott Wave Analysis

Gain a competitive edge with expert insights and AI-powered Elliott Wave charting into:

  • Global Indices
  • US Stocks & ASX Stocks
  • Forex & Crypto
  • Commodities
Top-Notch Trading Tools

Equip yourself with the tools of success:

  • Real-time Chat rooms
  • Elliott Wave Algorithm
  • Portfolio tools
  • TradingLevels
  • Screener
  • Trading Game
7 Elliott Wave Analysts

Stay ahead of the market with daily charts and insightful videos
Your secret to strategic trading!

JOIN HERE


Welcome to TradingLounge (ASIC A.R.No. 321187), specialists in trades, trading education and technical analysis, covering stocks, indices, commodities, forex and cryptocurrencies.

When you join TradingLounge you have access to everything we offer, including trade tools, educational content and a social platform to chat with like-minded investors.

Read more

@Copyright 2024 by tradinglounge.com

Contact Us

Australian no: 02 4787 6020

International no: +61 (2) 47876020

Pay with:

Find us on