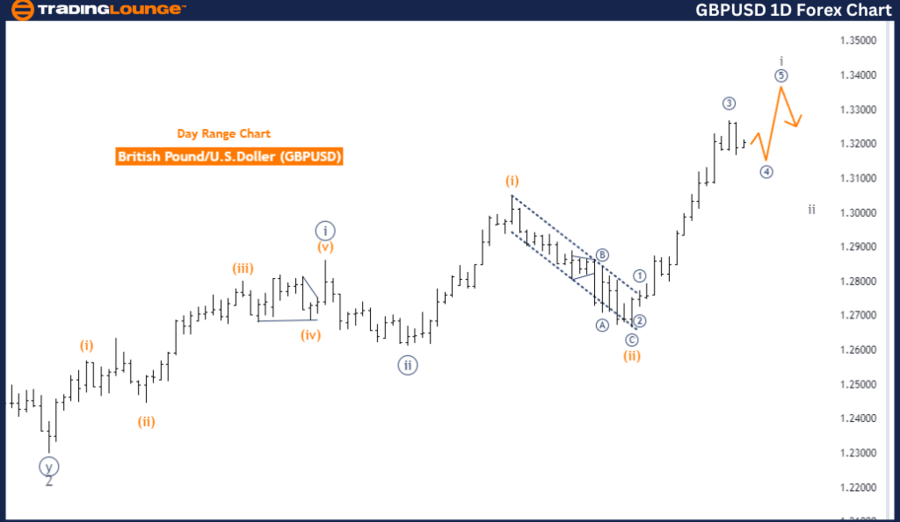
GBPUSD Elliott Wave Analysis - Trading Lounge Day Chart
British Pound/ U.S. Dollar (GBPUSD) Day Chart Analysis
GBPUSD Elliott Wave Technical Analysis
- Function: Bullish Trend
- Mode: Impulsive
- Structure: Gray Wave 1
- Position: Orange Wave 3
- Direction Next Lower Degrees: Gray Wave 2
- Details: Orange wave 2 of 3 appears to have concluded, with gray wave 1 of 3 currently unfolding.
The GBPUSD pair is currently exhibiting a bullish trend, as identified by Elliott Wave analysis on the daily chart. The market is in an impulsive phase, indicating a strong movement aligned with the overall trend. The primary structure under observation is gray wave 1, marking the beginning of a new wave sequence within the larger trend.
The market's current position is within orange wave 3, suggesting that the third wave of the orange degree is in progress. This follows the completion of orange wave 2, signaling the end of the corrective phase and the continuation of the next impulsive wave.
As for the next lower degrees, gray wave 2 is anticipated to form after the completion of the current gray wave 1. This implies that after the ongoing wave concludes, the market might experience a brief corrective phase before resuming its upward movement.
Specifically, orange wave 2 of 3 is now considered complete, shifting the focus to gray wave 1 of 3, which is currently progressing. This development indicates that the market has resumed its upward trend and is expected to continue in this direction as the new impulsive wave advances.
In summary, the GBPUSD pair is showing strong bullish momentum on the daily chart, with gray wave 1 currently in motion. Following the completion of corrective orange wave 2, the market is advancing in orange wave 3, suggesting the continuation of the upward trend. The analysis anticipates that this bullish momentum will likely persist, with a potential brief correction in gray wave 2 after the current wave concludes.
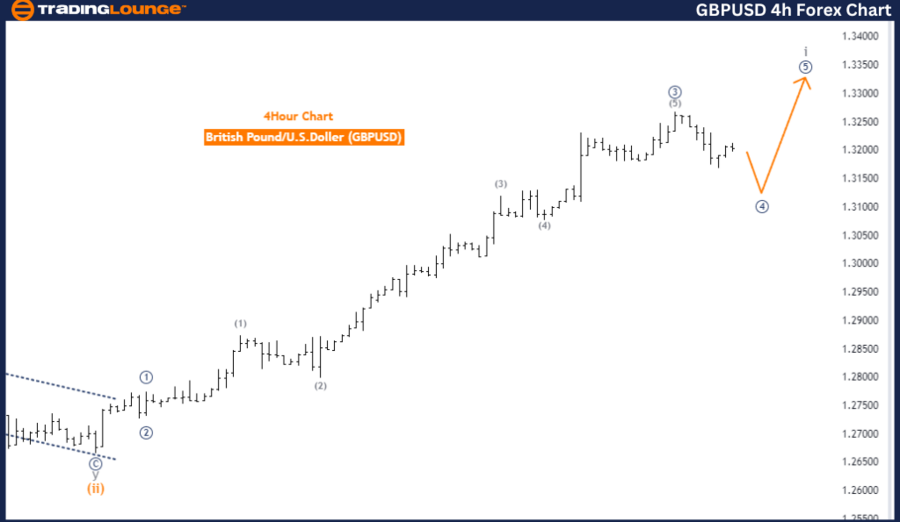
GBPUSD Elliott Wave Analysis - Trading Lounge 4-Hour Chart
British Pound/ U.S. Dollar (GBPUSD) 4 Hour Chart
GBPUSD Technical Analysis
- Function: Counter Trend
- Mode: Corrective
- Structure: Submicro Navy Blue Wave 4
- Position: Gray Wave 1
- Direction Next Higher Degrees: Submicro Navy Blue Wave 5
- Details: Submicro Navy Blue Wave 3 appears to have completed, with Submicro Navy Blue Wave 4 now unfolding.
The GBPUSD pair is currently in a counter-trend, as shown by Elliott Wave analysis on the 4-hour chart. This analysis indicates a corrective mode, suggesting that the market is experiencing a temporary pullback or consolidation phase within a larger trend. The primary structure under focus is Submicro Navy Blue Wave 4, a smaller corrective wave within the overall wave sequence.
The market is currently positioned in Gray Wave 1, indicating the start of a new sequence. However, the main attention is on Submicro Navy Blue Wave 4, which is actively unfolding. This wave follows the completion of Submicro Navy Blue Wave 3, indicating that the market has recently finished an upward move and is now in a corrective phase, possibly setting up for the next wave.
The next higher degree direction points to the formation of Submicro Navy Blue Wave 5, expected to develop after the current corrective wave concludes. This suggests that once Submicro Navy Blue Wave 4 is completed, the market could resume its previous trend with a new impulsive wave, potentially reversing the current correction.
In summary, the GBPUSD pair is in a corrective phase on the 4-hour chart, with Submicro Navy Blue Wave 4 currently progressing. This follows the completion of Submicro Navy Blue Wave 3, and the market is preparing for the potential development of Submicro Navy Blue Wave 5. The analysis suggests that after this corrective phase ends, the market may resume its trend with the next impulsive wave.
Technical Analyst: Malik Awais
Source: visit Tradinglounge.com and learn From the Experts Join TradingLounge Here
Previous: USDJPY Elliott Wave Technical Analysis
Special Trial Offer - 0.76 Cents a Day for 3 Months! Click here
Access 7 Analysts Over 200 Markets Covered. Chat Room With Support