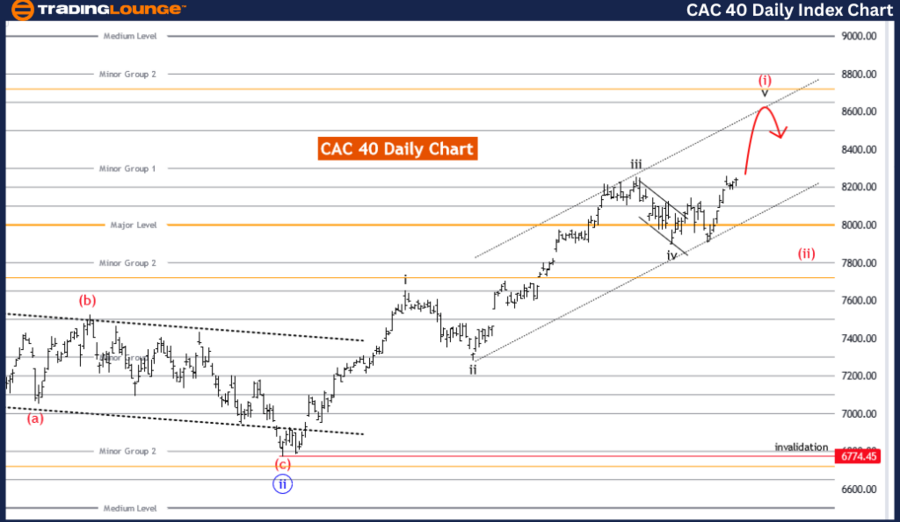
CAC 40 (France) Elliott Wave Analysis Trading Lounge Day Chart,
CAC 40 (France) Elliott Wave Technical Analysis
FUNCTION: Trend
MODE: impulsive
STRUCTURE: black wave 5
POSITION: Red Wave 1
DIRECTION NEXT LOWER DEGREES: red wave 2
DETAILS: black wave 4 looking completed at 7905.49. Now black wave 5 of 1 is in play .
Wave Cancel invalid level: 6774.45
Function:
The analysis identifies the current movement of the CAC 40 on the daily chart as part of a "Trend." This suggests that the waves being analyzed are in line with the prevailing market direction.
Mode:
The mode of the current market activity is "impulsive." In Elliott Wave theory, impulsive waves move in the direction of the trend and typically consist of five sub-waves (1, 2, 3, 4, and 5). These waves indicate strong market momentum in the trend's direction.
Structure:
The structure under examination is "black wave 5." This wave is part of the larger trend and is typically the final wave in the five-wave impulsive sequence, indicating the culmination of the trend's current phase.
Position:
The market is currently in "red wave 1," which is the first sub-wave of the larger black wave 5. This wave marks the beginning of a new impulsive sequence within the broader trend.
Direction for Next Lower Degrees:
The next anticipated movement is "red wave 2." In Elliott Wave terms, red wave 2 is expected to be a corrective wave that temporarily moves against the direction of red wave 1 before the trend resumes with red wave 3.
Details:
Wave Completion: The analysis notes that "black wave 4" appears to be completed at the level of 7905.49. The completion of black wave 4 sets the stage for the final black wave 5.
Current Wave in Play: The market is currently experiencing "black wave 5 of 1." This indicates that the first sub-wave (red wave 1) of the final black wave 5 is now active.
Invalidation Level: The wave cancellation or invalidation level is set at 6774.45. If the market drops below this level, the current wave count will be invalidated, suggesting a possible reevaluation of the wave structure.
Summary
The CAC 40 Elliott Wave analysis on the daily chart indicates the index is in the final stages of a significant trend phase, specifically within black wave 5. The market has completed black wave 4 at 7905.49 and is now in the initial stages of black wave 5, marked by the formation of red wave 1. Following red wave 1, a corrective red wave 2 is expected to play out. The analysis sets an invalidation level at 6774.45, where falling below this level would negate the current wave count and imply a potential shift in the market dynamics. This detailed wave structure provides traders with insights into the trend's continuation and critical reversal points to monitor.
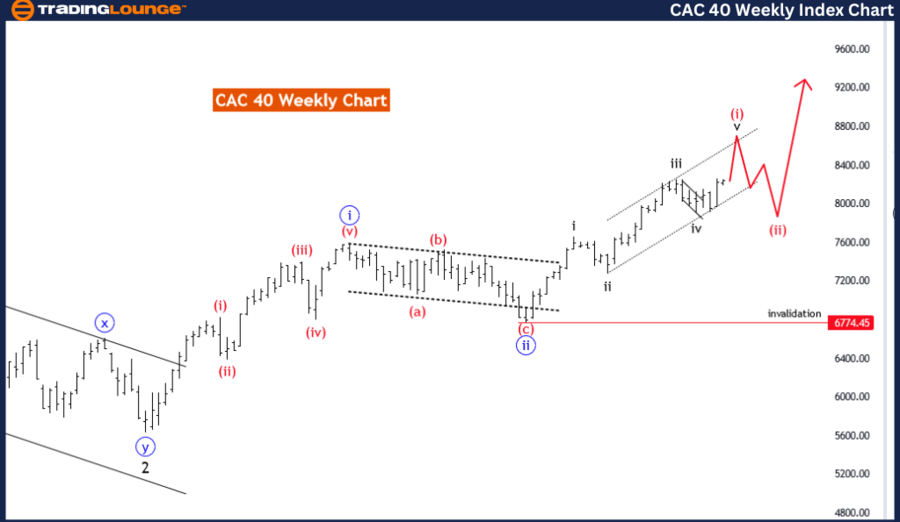
CAC 40 (France) Elliott Wave Analysis Trading Lounge Weekly Chart,
CAC 40 (France) Elliott Wave Technical Analysis
FUNCTION: Trend
MODE: impulsive
STRUCTURE: red wave
POSITION: Blue Wave 3
DIRECTION NEXT LOWER DEGREES: red wave 2
DETAILS: Red Wave 1 is in play and looking near to end.
Wave Cancel invalid level: 6774.45
Function:
The analysis identifies the current movement of the CAC 40 on the weekly chart as part of a "Trend." This indicates that the waves being analyzed are moving in the direction of the prevailing market trend.
Mode:
The mode of the current market activity is "impulsive." In Elliott Wave theory, impulsive waves are strong movements in the direction of the trend and typically consist of five sub-waves (1, 2, 3, 4, and 5). These waves signal robust market momentum aligned with the trend's direction.
Structure:
The structure under examination is "red wave 1." This wave is the initial wave in the impulsive sequence, setting the foundation for the larger trend movement.
Position:
The market is currently in "blue wave 3." This implies that within the broader impulsive structure, the market is experiencing the third wave of the blue degree, which is typically the strongest and most extended wave in the Elliott Wave sequence.
Direction for Next Lower Degrees:
The next anticipated movement is "red wave 2." In Elliott Wave terms, red wave 2 is expected to be a corrective wave that temporarily moves against the direction of red wave 1 before the trend resumes with red wave 3.
Details:
Wave Completion:The analysis notes that "red wave 1" is currently in play and appears to be nearing its end. This completion is crucial as it signals the transition to red wave 2, a corrective phase.
nvalidation Level: The wave cancellation or invalidation level is set at 6774.45. If the market falls below this level, the current wave count will be invalidated, suggesting a need to reassess the wave structure and potentially indicating a shift in market dynamics.
Summary
The CAC 40 Elliott Wave analysis on the weekly chart indicates that the index is currently experiencing an impulsive trend, specifically within red wave 1. This wave is part of a larger impulsive structure, positioned within blue wave 3, which typically represents strong market momentum. As red wave 1 nears its completion, the market is expected to transition into red wave 2, a corrective phase that temporarily moves against the trend. The analysis sets an invalidation level at 6774.45, where a drop below this level would negate the current wave count and imply a potential reevaluation of the market dynamics. This detailed wave structure provides traders with valuable insights into the trend's continuation and critical points for potential reversals.
Technical Analyst: Malik Awais
Source: visit Tradinglounge.com and learn From the Experts Join TradingLounge Here
See previous: TASI Index Elliott Wave Technical Analysis
Special Trial Offer - 0.76 Cents a Day for 3 Months! Click here
Access 7 Analysts Over 170 Markets Covered. Chat Room With Support