MCD Elliott Wave Analysis for McDonald’s Corp.

This Elliott Wave analysis for McDonald’s Corp. (MCD) examines the current market structure and future potential movements using Elliott Wave principles. We provide insights from both the daily and 4-hour charts to offer a comprehensive view of MCD's price action and anticipated trends.

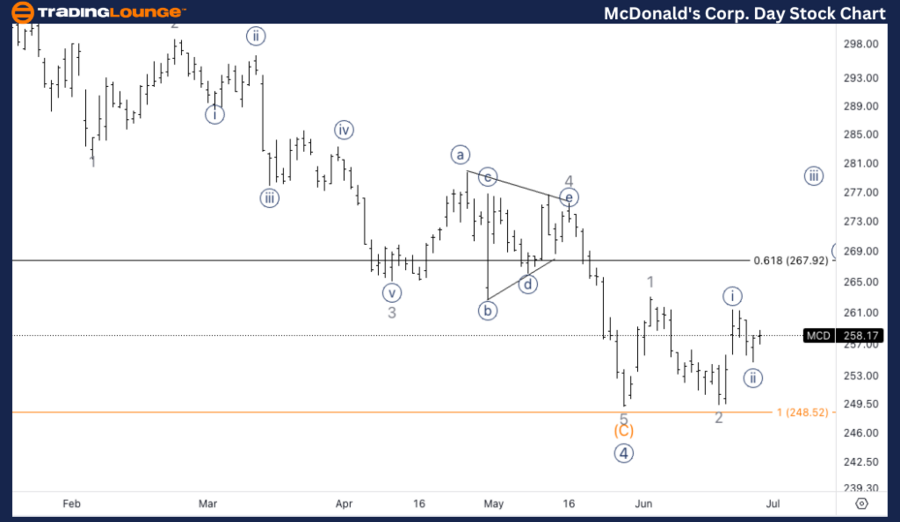
MCD Elliott Wave Analysis Trading Lounge Daily Chart

McDonald’s Corp., (MCD) Daily Chart Analysis

MCD Elliott Wave Technical Analysis

Function: Trend

Mode: Impulsive

Structure: Motive

Position: Wave 3 of (1)

Direction: Upside in wave 3

Details: We are looking for a potential bottom in Intermediate wave (C). Expecting a series of ones and twos before accelerating higher in wave three.

McDonald's stock forecast

We anticipate a potential bottom in Intermediate wave (C) and the development of a series of smaller waves (ones and twos) before wave 3 accelerates higher. This sequence suggests that wave 3 will show strong bullish momentum as it progresses. The critical area to monitor is the base of wave (C), providing crucial support for the anticipated upward movement in wave 3.

McDonalds-Corp-Day-S...


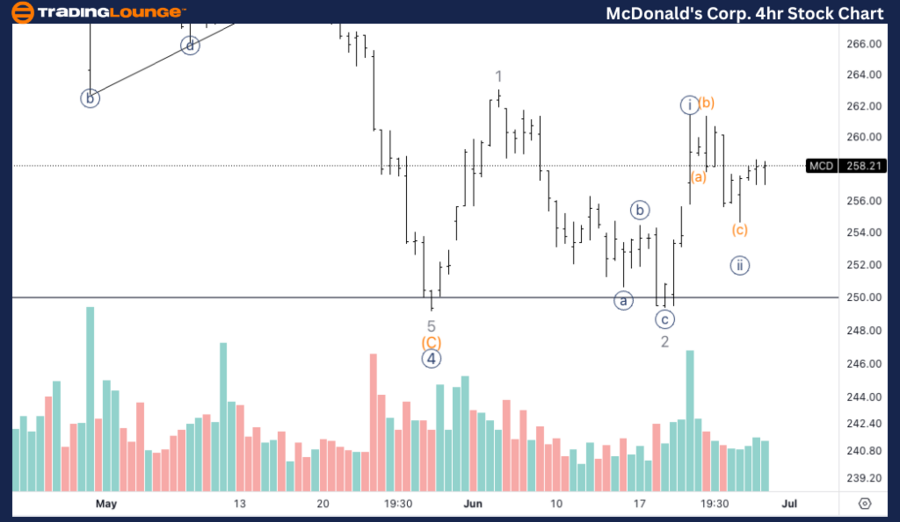
MCD Elliott Wave Analysis Trading Lounge 4-Hour Chart

McDonald’s Corp., (MCD) 4-Hour Chart Analysis

MCD Technical Analysis

Function: Trend

Mode: Impulsive

Structure: Motive

Position: Wave {iii} of 3

Direction: Upside in {iii}

Details: We are looking for acceleration higher if we are in the third of a third. Volume appears to support a bullish scenario.

MCD Elliott Wave Technical Analysis

We expect further acceleration higher if we are in the third wave of a third wave scenario. This implies strong bullish momentum and volume, aligning with the wave count and suggesting a continuation of the upward trend. Volume analysis supports this bullish outlook, indicating increased buying pressure typically accompanying third waves, especially in the third wave of the sequence.

Technical Analyst: Alessio Barretta

Source: visit Tradinglounge.com and learn From the Experts Join TradingLounge Here 

See Previous: NextEra Energy Inc Elliott Wave Technical Analysis

Special Trial Offer - 0.76 Cents a Day for 3 Months! Click here

Access 7 Analysts Over 170 Markets Covered. Chat Room With Support

McDonalds-Corp-4hr-S...

Related

Unlock BNBUSD's Next Big Move: Expert Elliott Wave Analysis & Binance Coin Price Prediction

Unlock BNBUSD's Next Big Move: Expert Elliott Wave Analysis & Binance Coin Price Prediction

This article provides a comprehensive BNBUSD Elliott Wave analysis, focusing on Binance Coin's p...

Read More >
Comprehensive Dogecoin/ U.S. dollar (DOGEUSD) Elliott Wave Analysis: Crypto Trading Strategies and Technical Indicators

Comprehensive Dogecoin/ U.S. dollar (DOGEUSD) Elliott Wave Analysis: Crypto Trading Strategies and Technical Indicators

Delve into an in-depth Elliott Wave Technical analysis of Dogecoin/ U.S. dollar(DOGEUSD), revealing ...

Read More >
Stock Market Topping: SP500, NASDAQ, DAX 40, FTSE 100, ASX200. Elliott Wave Insights & Strategies

Stock Market Topping: SP500, NASDAQ, DAX 40, FTSE 100, ASX200. Elliott Wave Insights & Strategies

Tech stocks currently undergoing an ABC Zigzag correction pattern, impacting Nasdaq 100, S&P 500, an...

Read More >
U.S.Dollar/Japanese Yen(USDJPY) Forex Elliott Wave Technical Analysis: Navigating Market Trends with Predictive Currency Insights

U.S.Dollar/Japanese Yen(USDJPY) Forex Elliott Wave Technical Analysis: Navigating Market Trends with Predictive Currency Insights

Our USDJPY Elliott Wave Analysis provides a detailed examination of potential price movements for th...

Read More >
WTI Crude Oil Elliott Wave Technical Analysis: Timing the End of Corrective Rally

WTI Crude Oil Elliott Wave Technical Analysis: Timing the End of Corrective Rally

Stay ahead of the curve with the latest analysis of WTI Crude's corrective rally through Elliott...

Read More >
Detailing the Current Market Phases on both Daily and Weekly Charts: NIFTY 50(INDIA) Indices Elliott Wave Technical Analysis

Detailing the Current Market Phases on both Daily and Weekly Charts: NIFTY 50(INDIA) Indices Elliott Wave Technical Analysis

This article provides a thorough Elliott Wave analysis of the NIFTY 50 (India) index, detailing the ...

Read More >

Buy 1 Month

Get 3 Months!

Special Offer:

Trade Recommendations

Unleash the power of deversified trading with our comprehensive portfolio, covering:

  • Stock Trades
  • Crypto Trades
  • Forex Trades
  • Commodity Trades
Elliott Wave Analysis

Gain a competive edge with expert insights in to:

  • Global Indices
  • US Stocks & ASX Stocks
  • Forex & Crypto
  • Commodities
Top-Notch Trading Tools

Equip yourself with the tools of success:

  • Social Chat
  • Elliott Wave Algorithm
  • Screener
  • TradingLevels
  • Trading Game
7 Elliott Wave Analysts

Stay ahead of the market with daily charts and insightful videos
-Your secret to strategic trading!

JOIN HERE


Welcome to TradingLounge (ASIC A.R.No. 321187), specialists in trades, trading education and technical analysis, covering stocks, indices, commodities, forex and cryptocurrencies.

When you join TradingLounge you have access to everything we offer, including trade tools, educational content and a social platform to chat with like-minded investors.

Read more

@Copyright 2024 by tradinglounge.com

Contact Us

Australian no: 02 4787 6020

International no: +61 (2) 47876020

Pay with:

Find us on