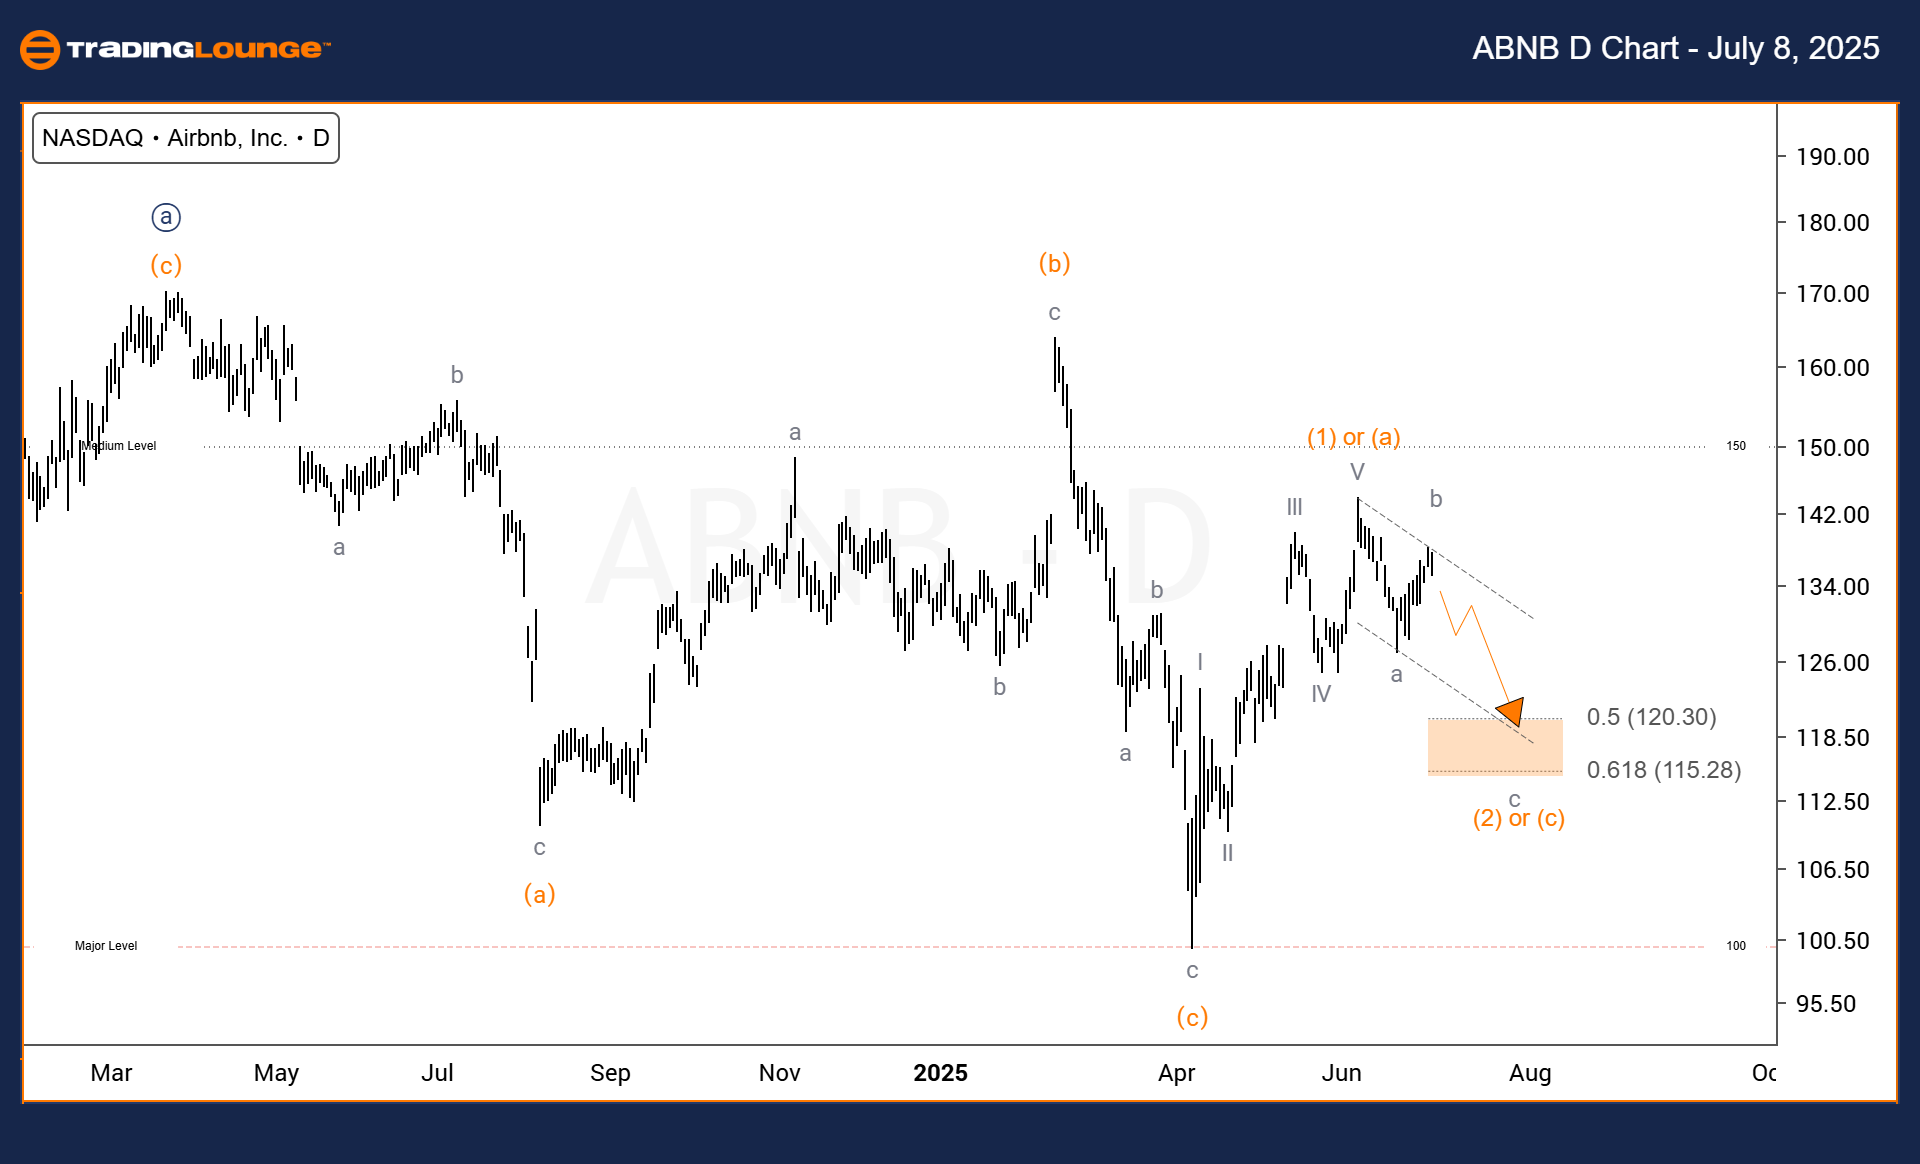
Airbnb Inc. (ABNB) Elliott Wave Analysis | Trading Lounge Daily Chart
Airbnb Inc. (ABNB) Daily Chart Overview
Airbnb Inc. (ABNB) Elliott Wave Technical Analysis
FUNCTION: Counter Trend
MODE: Corrective
STRUCTURE: Corrective
POSITION: Wave c of (2)
DIRECTION: Downtrend in Wave c
DETAILS:
After completing a five-wave bullish structure, Airbnb Inc. (NASDAQ: ABNB) is currently undergoing a corrective retracement. The price action is aligning with key Fibonacci support zones—specifically the 50% and 61.8% levels—indicating a textbook Elliott Wave correction is unfolding.
On the daily timeframe, ABNB appears to be forming a classic zigzag corrective pattern. The downward price movement followed by a retracement suggests that Wave c of (2) is actively developing. This pattern points toward continued downside pressure as the final leg of the corrective sequence approaches completion.
With Wave b approaching its termination, the emergence of Wave c is anticipated to push the stock price lower in the near term. This movement aligns with short-term bearish sentiment and could offer strategic short-selling opportunities for traders seeking to trade in sync with the ongoing corrective trend.
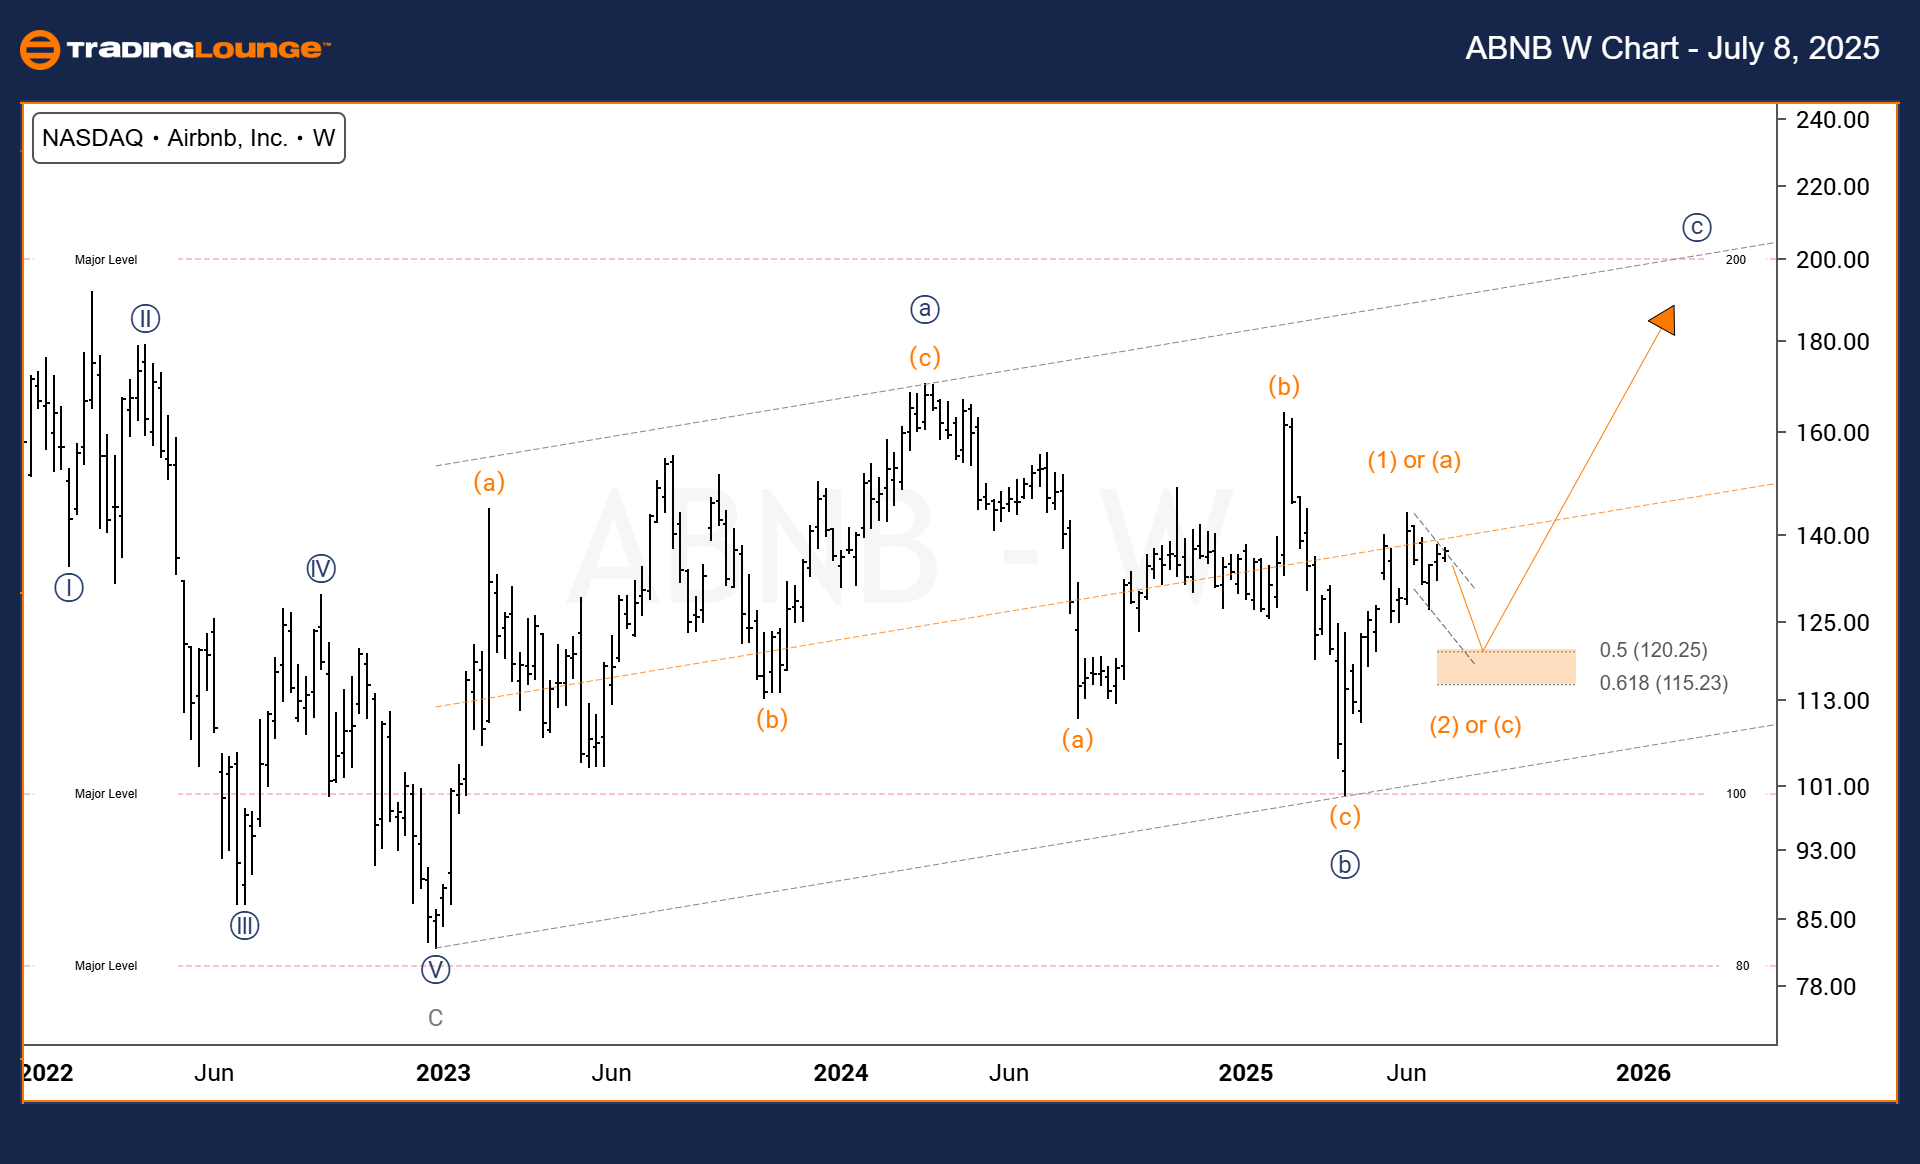
Airbnb Inc. (ABNB) – Elliott Wave Analysis | TradingLounge Weekly Chart
ABNB Technical Analysis And Overview
FUNCTION: Counter Trend
MODE: Corrective
STRUCTURE: Corrective
POSITION: Wave (2) of {C}
DIRECTION: Downtrend targeting Wave (2) completion
DETAILS:
Airbnb Inc.’s weekly chart reflects a larger-scale corrective phase within its broader market cycle. The current move is forming Wave (2) of {C}, retracing the previous impulsive Wave (1) toward the 50% to 61.8% Fibonacci support range.
This retracement suggests the development of a potential bottoming zone. The corrective structure unfolding points toward a setup for a possible bullish reversal upon completion. Traders are encouraged to monitor price action closely near these key Fibonacci levels for signs of consolidation or reversal.
Once Wave (2) completes, the beginning of a new impulsive rally is likely. This could mark the start of Wave (3), presenting an entry point for bullish setups aligned with the long-term uptrend in ABNB stock.
Technical Analyst: Dhiren Pahuja
Visit: TradingLounge.com for detailed analysis and market updates.
Previous: Snowflake (SNOW) Elliott Wave Technical Analysis
VALUE Offer - $1 for 2 Weeks then $29 a month!Click here
Access 7 Analysts Over 200 Markets Covered. Chat Room With Support