Soybean Elliott Wave Technical Analysis

The bounce from August seems to have ended, with the commodity now targeting a new low for the year. This indicates that the bearish sequence from June 2022 is expected to extend further.

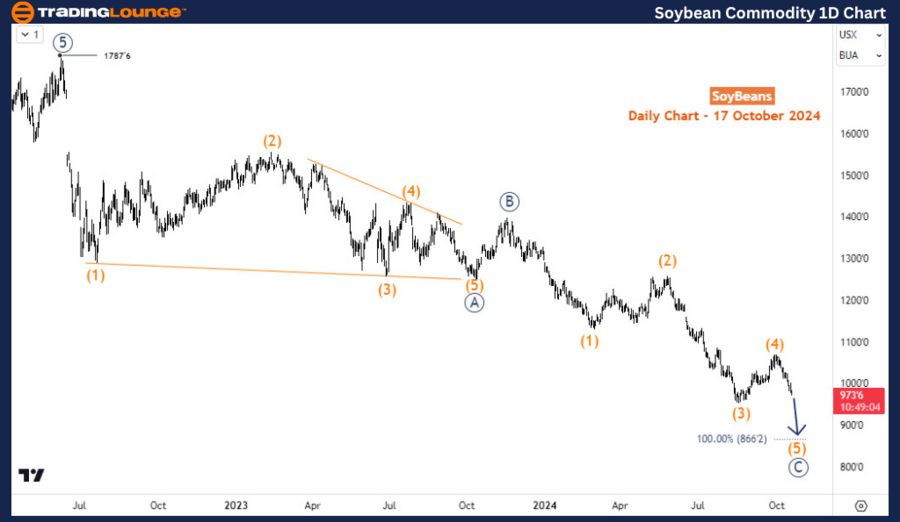
Soybean Commodity Daily Chart Analysis

Soybean Elliott Wave Analysis

Soybeans are in a bearish corrective phase on the daily chart, correcting the impulse wave cycle that spanned from May 2019 to June 2022. From the June 2022 high, a 3-wave structure is expected. Wave ((A)) concluded in October 2023 with a diagonal structure, followed by a shallow bounce for wave ((B)), which reached the high in November 2023. Since then, a bearish impulse wave has developed for wave ((C)). Price completed wave (4) of ((C)) in September 2024, leading to a sell-off in wave (5) of ((C)). Wave (5) may extend to the 866-661 zone before a recovery occurs.

Alternatively, the drop from the June 2022 high ($1787) might form an impulsive structure if the price breaks below 535. In either scenario, the downside is expected to continue in the upcoming weeks.

Soybean-Commodity-Da...


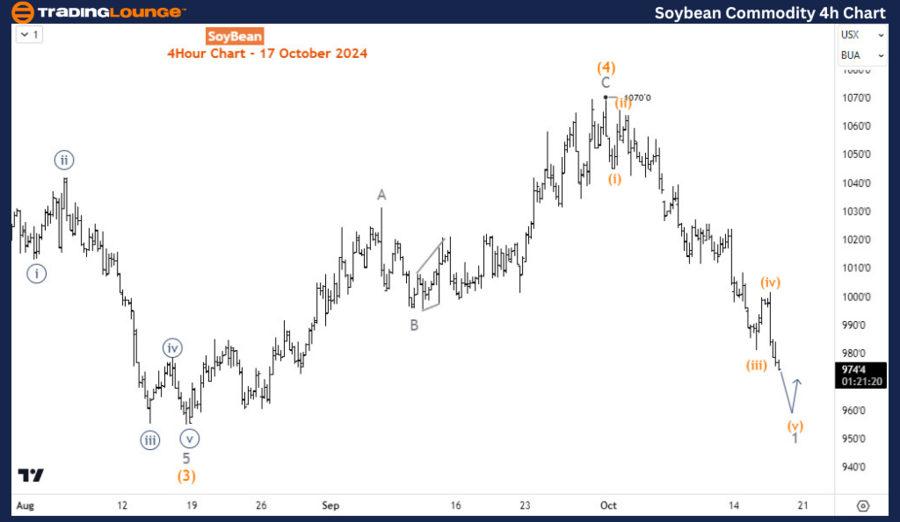
Soybean Commodity H4 Chart Outlook

On the H4 chart, the price remains in wave 1 of (5). This suggests that traders should focus on selling bounces. The decline is likely to breach the 866 level and move toward 661 before completing the impulse wave for (5) of ((C)).

Technical Analyst: Sanmi Adeagbo

Source: visit Tradinglounge.com and learn From the Experts Join TradingLounge Here 

See Previous: Copper Elliott Wave Technical Analysis

VALUE Offer - Buy 1 Month & Get 3 Months!Click here

Access 7 Analysts Over 200 Markets Covered. Chat Room With Support

Soybean-Commodity-4h...

Related

Johnson & Johnson (JNJ) Elliott Wave Analysis Reveals Bullish Stock Forecast, Price Prediction, and Key Trading Strategies

Johnson & Johnson (JNJ) Elliott Wave Analysis Reveals Bullish Stock Forecast, Price Prediction, and Key Trading Strategies

Johnson & Johnson (JNJ) with Elliott Wave Theory, covering trend positions, price forecasts, bullish...

Read More >
S&P 500 Elliott Wave Forecast: Bullish Trend Develops as SPX Forms Wave 1 of 3 After Completing Wave 2 Correction

S&P 500 Elliott Wave Forecast: Bullish Trend Develops as SPX Forms Wave 1 of 3 After Completing Wave 2 Correction

S&P 500 is forming a bullish Elliott Wave impulse pattern. Gray wave 2 is complete and navy blue wav...

Read More >
State Bank of India stock analysis using Elliott Wave forecast reveals bullish trend, share price movement, and market outlook.

State Bank of India stock analysis using Elliott Wave forecast reveals bullish trend, share price movement, and market outlook.

State Bank of India (SBI) through the lens of Elliott Wave Theory. It highlights the current bullish...

Read More >
Learn how to apply Elliott Wave theory to forecast NEO price and optimize your crypto trading strategy with NEOUSD Technical Analysis

Learn how to apply Elliott Wave theory to forecast NEO price and optimize your crypto trading strategy with NEOUSD Technical Analysis

This article offers a comprehensive Elliott Wave analysis of NEOUSD, providing insights into NEO pri...

Read More >
AUDUSD Elliott Wave Analysis: In-Depth Insights on 4-Hour and Day Charts - February 6, 2024

AUDUSD Elliott Wave Analysis: In-Depth Insights on 4-Hour and Day Charts - February 6, 2024

This detailed analysis delves into the AUDUSD currency pair's Elliott Wave patterns, examining b...

Read More >
British Pound/U.S.Dollar(GBPUSD) Forex Elliott Wave Technical Analysis: Day and 4-Hour Charts Overview

British Pound/U.S.Dollar(GBPUSD) Forex Elliott Wave Technical Analysis: Day and 4-Hour Charts Overview

This article offers a comprehensive guide to trading the GBP/USD pair using the Elliott Wave theory....

Read More >

Buy 1 Month

Get 3 Months!

Special Offer:

Trade Recommendations

Unleash the power of deversified trading with our comprehensive portfolio, covering:

  • Stock Trades
  • Crypto Trades
  • Forex Trades
  • Commodity Trades
Elliott Wave Analysis

Gain a competive edge with expert insights in to:

  • Global Indices
  • US Stocks & ASX Stocks
  • Forex & Crypto
  • Commodities
Top-Notch Trading Tools

Equip yourself with the tools of success:

  • Social Chat
  • Elliott Wave Algorithm
  • Screener
  • TradingLevels
  • Trading Game
7 Elliott Wave Analysts

Stay ahead of the market with daily charts and insightful videos
-Your secret to strategic trading!

JOIN HERE


Welcome to TradingLounge (ASIC A.R.No. 321187), specialists in trades, trading education and technical analysis, covering stocks, indices, commodities, forex and cryptocurrencies.

When you join TradingLounge you have access to everything we offer, including trade tools, educational content and a social platform to chat with like-minded investors.

Read more

@Copyright 2024 by tradinglounge.com

Contact Us

Australian no: 02 4787 6020

International no: +61 (2) 47876020

Pay with:

Find us on