Copper Elliott Wave Technical Analysis

Copper Elliott Wave Analysis

Copper prices have pulled back from their September 2024 highs, correcting the bullish movement seen in August and September 2024. This correction is expected to complete soon, after which the bullish trend is likely to resume.

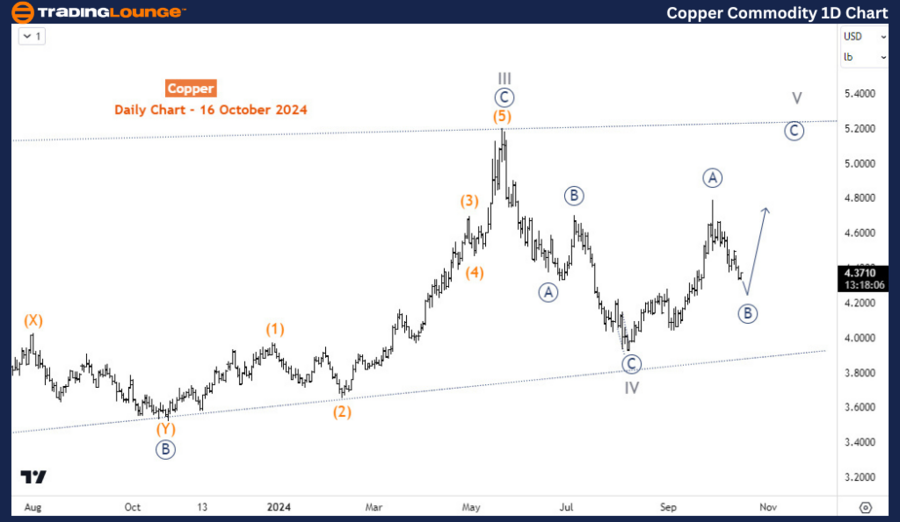
Copper Commodity Daily Chart Analysis

From a long-term perspective, Copper's price has been developing in a diagonal wave structure since the March 2020 lows. On the daily chart, wave I of the cycle degree concluded in March 2022, followed by a decline for wave II that ended in July 2022. Waves III and IV were completed in May 2024 and August 2024, respectively. The current rise from the August 2024 lows is likely the beginning of wave V. Once wave V completes, a larger correction is anticipated to correct the entire five-wave diagonal structure from March 2020.

Wave V is projected to develop in a corrective three-wave structure. It now appears that wave ((A)) of V concluded in September 2024, and the current pullback is wave ((B)). The H4 chart offers insight into how far wave ((B)) has progressed and its potential continuation.

Copper-Commodity-1D-...


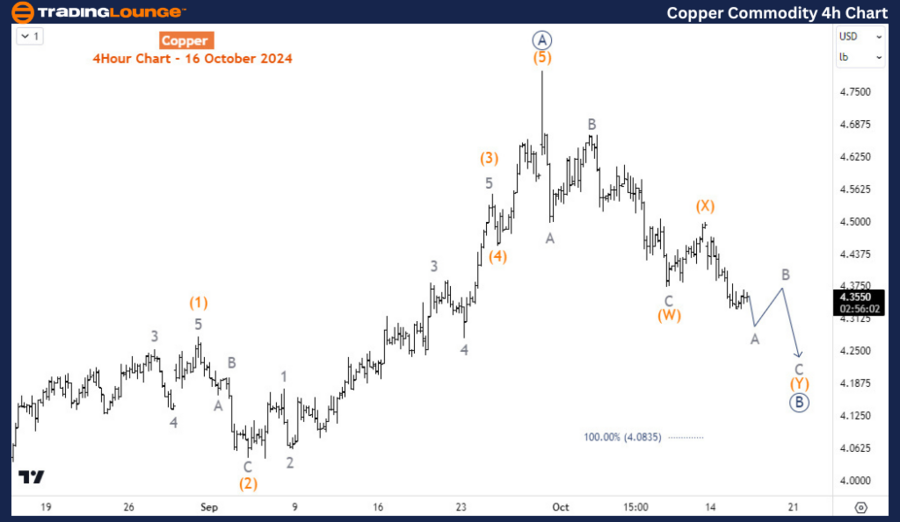
Copper Commodity H4 Chart Analysis

On the H4 chart, wave ((A)) completed as a five-wave impulse structure. The ongoing pullback, wave ((B)), is emerging as a double zigzag pattern. Projections suggest wave (Y) of ((B)) could push the price lower to 4.083. If the price fails to reach this level and instead stages a strong five-wave rally toward October highs, it would confirm that wave ((B)) is complete, signaling the start of wave ((C)). Otherwise, in the short term, downside movement toward 4.083 is favored.

Technical Analyst: Sanmi Adeagbo

Source: visit Tradinglounge.com and learn From the Experts Join TradingLounge Here 

See Previous: Cocoa Elliott Wave Technical Analysis 

VALUE Offer - Buy 1 Month & Get 3 Months!Click here

Access 7 Analysts Over 200 Markets Covered. Chat Room With Support

Copper-Commodity-4H-...

Related

NJ Elliott Wave Technical Analysis Trading Lounge: Daily and 4-Hour Charts for Johnson & Johnson (JNJ) Stock

NJ Elliott Wave Technical Analysis Trading Lounge: Daily and 4-Hour Charts for Johnson & Johnson (JNJ) Stock

This article provides a detailed Elliott Wave analysis of Johnson & Johnson (JNJ), examining potenti...

Read More >
Actionable Forex Trading Strategies for Euro/U.S. Dollar Using EURUSD Elliott Wave Technical Analysis With Chart Insight

Actionable Forex Trading Strategies for Euro/U.S. Dollar Using EURUSD Elliott Wave Technical Analysis With Chart Insight

This comprehensive analysis covers the EURUSD Elliott Wave structure on both daily and 4-hour charts...

Read More >
Alphabet Inc.(GOOGL:NASDAQ) Elliott Wave Technical Analysis 12 January 24

Alphabet Inc.(GOOGL:NASDAQ) Elliott Wave Technical Analysis 12 January 24

Alphabet Inc.(GOOGL: NASDAQ) Elliott Wave Technical Analysis with 4h and 1h Chart dated 12 January 2...

Read More >
DOW JONES (DJI) Index Elliott Wave Technical Analysis Identifies Current Market Trends Help Traders to Navigate Movements

DOW JONES (DJI) Index Elliott Wave Technical Analysis Identifies Current Market Trends Help Traders to Navigate Movements

DOW JONES (DJI) Elliott Wave Analysis identifies current market trends and wave patterns to help tra...

Read More >
ASX Stock Trading Success: TRANSURBAN GROUP (TCL) Stock Forecast & TCL Elliott Wave Technical Analysis

ASX Stock Trading Success: TRANSURBAN GROUP (TCL) Stock Forecast & TCL Elliott Wave Technical Analysis

Explore the comprehensive Elliott Wave analysis of ASX TRANSURBAN GROUP (TCL). This analysis covers ...

Read More >
Elliott Wave Analysis Guide: Mastering Stock Market Trends in S&P 500, NASDAQ 100, RUSSELL 2000, DAX 40, FTSE 100, ASX 200

Elliott Wave Analysis Guide: Mastering Stock Market Trends in S&P 500, NASDAQ 100, RUSSELL 2000, DAX 40, FTSE 100, ASX 200

The latest Elliott Wave Analysis suggests a strategic approach to trading in the upcoming Friday'...

Read More >

$1 for 2 Weeks

then $29 a month!

What a Special Offer!

Trade Recommendations

Unleash the power of deversified trading with our comprehensive portfolio, covering 250+ markets:

  • Stock Trades
  • Crypto Trades
  • Forex Trades
  • Commodity Trades
Elliott Wave Analysis

Gain a competitive edge with expert insights and AI-powered Elliott Wave charting into:

  • Global Indices
  • US Stocks & ASX Stocks
  • Forex & Crypto
  • Commodities
Top-Notch Trading Tools

Equip yourself with the tools of success:

  • Real-time Chat rooms
  • Elliott Wave Algorithm
  • Portfolio tools
  • TradingLevels
  • Screener
  • Trading Game
7 Elliott Wave Analysts

Stay ahead of the market with daily charts and insightful videos
Your secret to strategic trading!

JOIN HERE


Welcome to TradingLounge (ASIC A.R.No. 321187), specialists in trades, trading education and technical analysis, covering stocks, indices, commodities, forex and cryptocurrencies.

When you join TradingLounge you have access to everything we offer, including trade tools, educational content and a social platform to chat with like-minded investors.

Read more

@Copyright 2024 by tradinglounge.com

Contact Us

Australian no: 02 4787 6020

International no: +61 (2) 47876020

Pay with:

Find us on