Cocoa Commodity Elliott Wave Technical Analysis

Since reaching its record high of 11,722 in April 2024, cocoa prices have undergone a correction, moving lower. In the months following this peak, the commodity lost around 40% of its value. The recent sell-off appears to be correcting the bullish impulse sequence that began in September 2022.

Cocoa Commodity Daily Chart Analysis

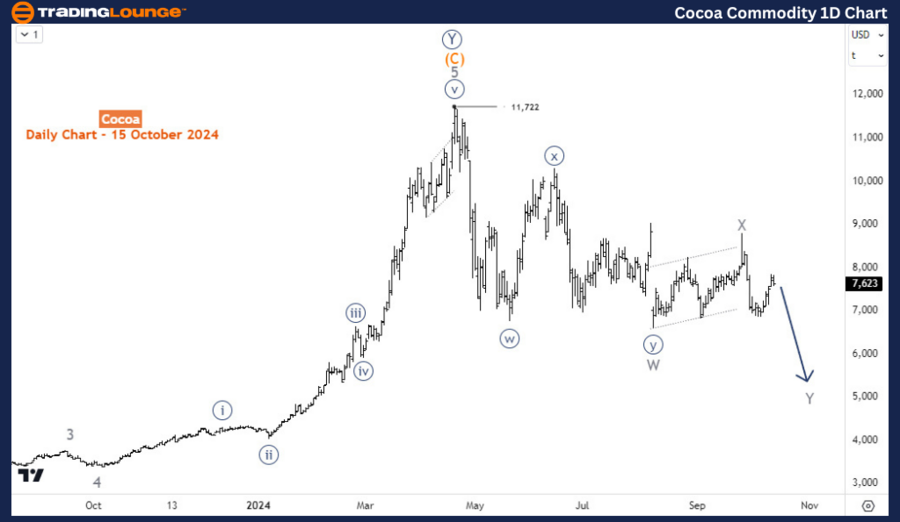
The daily chart shows a completed impulse wave rally starting in September 2022, peaking at the 11,722 level in April 2024. From that high, prices have been in a correction phase. This downward movement follows a double zigzag corrective structure.

  • Wave W completed in August 2024, followed by a Wave X bounce, which ended in late September 2024.
  • Now, the focus shifts to Wave Y, which is expected to extend downward, with a potential target near the 5,000 support level.

Alternative Elliott Wave Scenario

In case the decline stops above 6,000, followed by another corrective bounce, it may suggest a leading diagonal pattern in Wave A of the decline from 11,722. The bounce would then be Wave B, setting the stage for a Wave C decline toward 5,000 or lower. This scenario supports the medium-term bearish outlook for cocoa prices.

Cocoa-Commodity-1D-C...


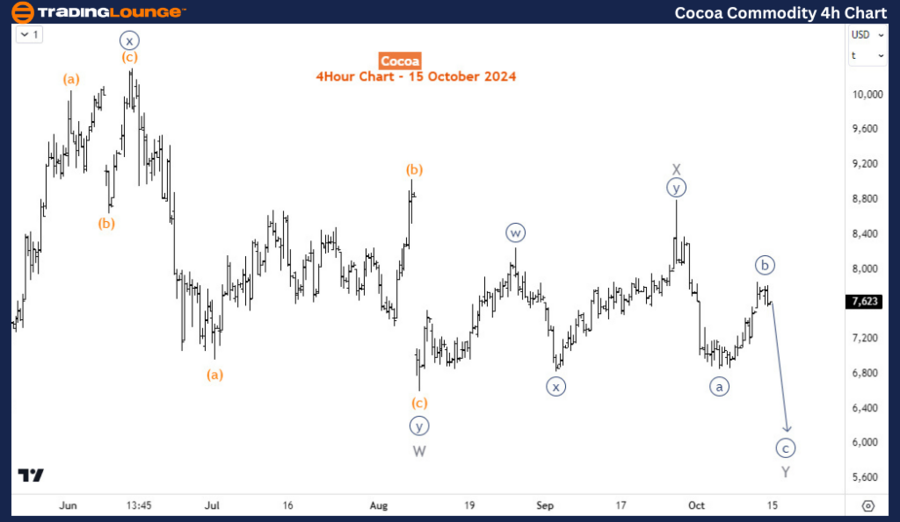
Cocoa Commodity H4 Chart Analysis

On the 4-hour chart, the current bounce represents Wave ((b)) of Y. Once this bounce completes, Wave ((c)) of Y should follow, with 5,000 or lower as a likely target.

Technical Analyst: Sanmi Adeagbo

Source: visit Tradinglounge.com and learn From the Experts Join TradingLounge Here 

See Previous: Gold (XAUUSD) Elliott Wave Technical Analysis 

VALUE Offer - Buy 1 Month & Get 3 Months!Click here

Access 7 Analysts Over 200 Markets Covered. Chat Room With Support

Cocoa-Commodity-4H-C...

Related

Visa Inc. (V) Stock Analysis: Elliott Wave Insights, Price Forecasts & Trading Trends with Daily and Hourly Chart Breakdowns

Visa Inc. (V) Stock Analysis: Elliott Wave Insights, Price Forecasts & Trading Trends with Daily and Hourly Chart Breakdowns

Explore Visa stock trends and forecasts through Elliott Wave Analysis. Learn about Visa's bullis...

Read More >
INFOSYS INFY Elliott Wave Analysis: Bearish Trend, Impulsive Structure, and Trading Strategy for Daily & Weekly Charts

INFOSYS INFY Elliott Wave Analysis: Bearish Trend, Impulsive Structure, and Trading Strategy for Daily & Weekly Charts

Infosys uses Elliott Wave theory to analyze the current market structure on both daily and weekly ch...

Read More >
 NASDAQ Stock Market Report: AAPL, TSLA, AMZN, NVDA, MSFT, Meta Platforms, NFLX, GOOGL

NASDAQ Stock Market Report: AAPL, TSLA, AMZN, NVDA, MSFT, Meta Platforms, NFLX, GOOGL

NASDAQ-listed stocks, including AAPL, TSLA, AMZN, NVDA, MSFT, Meta Platforms, NFLX, and GOOGL. The a...

Read More >
Elliott Wave Analysis of S&P BSE SENSEX NEXT 50 Shows Bullish Trend with Wave 3 in Play and Key Support at 70146

Elliott Wave Analysis of S&P BSE SENSEX NEXT 50 Shows Bullish Trend with Wave 3 in Play and Key Support at 70146

Elliott Wave technical analysis of the S&P BSE SENSEX NEXT 50 shows a strong bullish impulsive struc...

Read More >
NVIDIA Corp. (NVDA) Stock Analysis: Elliott Wave Forecast, Bullish Trend Insights, Technical Chart Patterns

NVIDIA Corp. (NVDA) Stock Analysis: Elliott Wave Forecast, Bullish Trend Insights, Technical Chart Patterns

NVIDIA (NVDA) stock analysis focuses on Elliott Wave Theory to forecast trends and price movements. ...

Read More >

Buy 1 Month

Get 3 Months!

Special Offer:

Trade Recommendations

Unleash the power of deversified trading with our comprehensive portfolio, covering:

  • Stock Trades
  • Crypto Trades
  • Forex Trades
  • Commodity Trades
Elliott Wave Analysis

Gain a competive edge with expert insights in to:

  • Global Indices
  • US Stocks & ASX Stocks
  • Forex & Crypto
  • Commodities
Top-Notch Trading Tools

Equip yourself with the tools of success:

  • Social Chat
  • Elliott Wave Algorithm
  • Screener
  • TradingLevels
  • Trading Game
7 Elliott Wave Analysts

Stay ahead of the market with daily charts and insightful videos
-Your secret to strategic trading!

JOIN HERE


Welcome to TradingLounge (ASIC A.R.No. 321187), specialists in trades, trading education and technical analysis, covering stocks, indices, commodities, forex and cryptocurrencies.

When you join TradingLounge you have access to everything we offer, including trade tools, educational content and a social platform to chat with like-minded investors.

Read more

@Copyright 2024 by tradinglounge.com

Contact Us

Australian no: 02 4787 6020

International no: +61 (2) 47876020

Pay with:

Find us on