16Apr

Newmont Corporation (ASX:NEM) Elliott Wave Stock Analysis Reveals Bullish Wave 3 With Price Targets of $100 and $102.37

ASX: NEWMONT CORPORATION – NEM Elliott Wave Technical Analysis – TradingLounge

Greetings,
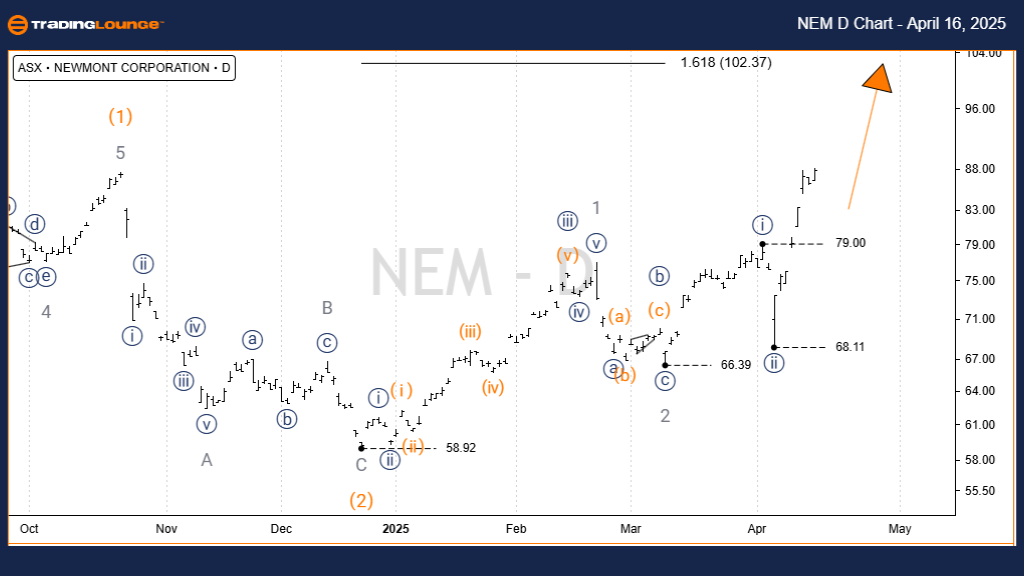
This Elliott Wave forecast for Newmont Corporation (ASX:NEM) highlights its current bullish trend, indicating progress within a strong Wave 3 structure. Based on our latest technical analysis, this phase presents ongoing upside potential. The following report details Elliott Wave targets and invalidation levels for assessing the stock’s strength and trading opportunities.


ASX: NEWMONT CORPORATION – NEM 1D Chart (Semilog Scale) Analysis

Function: Major trend (Intermediate degree, orange)

Mode: Motive

Structure: Impulse

Position: Wave 3 - grey of Wave (3) - orange

Details:
Wave (2) - orange completed near 58.92, marking the beginning of a new bullish phase in Wave (3) - orange. This upward impulse is unfolding into sub-waves: Wave 1 - grey, Wave 2 - grey, and the currently active Wave 3 - grey. Key near-term resistance is projected at $100.00, with an extended bullish target at $102.37.

Invalidation Point: 68.11

NEWMONT-1d-asx-chart...


ASX: NEWMONT CORPORATION – NEM 4-Hour Chart Analysis

Function: Major trend (Minor degree, grey)

Mode: Motive

Structure: Impulse

Position: Wave ((iii)) - navy of Wave 3 - grey

Details:
Since the $58.92 low, Wave (3) - orange has shown consistent bullish development. Within this broader wave, Wave ((iii)) - navy is currently unfolding, with price action aiming toward the $102.37 level. To confirm this impulsive move, the price must stay above the $79.00 threshold to prevent overlap between Wave ((iv)) - navy and Wave ((i)) - navy.

Invalidation Point: 79.00

Technical Analyst: Hua (Shane) Cuong, CEWA-M (Master’s Designation).

Source: Visit Tradinglounge.com and learn from the Experts. Join TradingLounge Here 

See Previous: AMCOR PLC – AMC Elliott Wave Technical Analysis

VALUE Offer - Buy 1 Month & Get 3 Months!Click here

Access 7 Analysts Over 200 Markets Covered. Chat Room With Support

NEWMONT-4h-asx-chart...


Conclusion:

This Elliott Wave analysis for ASX: NEWMONT CORPORATION – NEM offers strategic insights into the prevailing uptrend and potential bullish targets. Clear validation and invalidation points enhance the accuracy of this wave count, supporting better-informed trading decisions. Traders can use this analysis to confidently monitor market conditions and capitalize on high-probability setups in Newmont’s price action.

Related

Elliott Wave Trading Strategies: SP500, NASDAQ Tech Stocks & Key Earnings (April 2025)

Elliott Wave Trading Strategies: SP500, NASDAQ Tech Stocks & Key Earnings (April 2025)

Stay ahead in the markets with our detailed Elliott Wave analysis. This post delivers expert insight...

Read More >
A Technical Breakdown: Bitcoin Crypto Price News Today Bitcoin/U.S. Dollar (BTCUSD) Elliott Wave Technical Analysis

A Technical Breakdown: Bitcoin Crypto Price News Today Bitcoin/U.S. Dollar (BTCUSD) Elliott Wave Technical Analysis

This article provides a detailed Elliott Wave Analysis of the Bitcoin/U.S. Dollar (BTCUSD) trading p...

Read More >
Elliott Wave Analysis: Key Commodity Market Opportunities Unveiled

Elliott Wave Analysis: Key Commodity Market Opportunities Unveiled

Our latest Elliott Wave analysis provides a deep dive into the commodity markets, highlighting signi...

Read More >
Australian Dollar / Japanese Yen(AUDJPY) Elliott Wave Technical Analysis 14 November 23

Australian Dollar / Japanese Yen(AUDJPY) Elliott Wave Technical Analysis 14 November 23

Australian Dollar / Japanese Yen(AUDJPY) Elliott Wave Technical Analysis 14 November 23, In summary,...

Read More >
Anticipate the Forex Market Movements for the Australian Dollar against the U.S. Dollar: AUDUSD Elliott Wave Technical Analysis

Anticipate the Forex Market Movements for the Australian Dollar against the U.S. Dollar: AUDUSD Elliott Wave Technical Analysis

This analysis covers the AUDUSD pair using Elliott Wave theory, providing key insights into current ...

Read More >
Bitcoin / U.S. dollar(BTCUSD) Elliott Wave Technical Analysis 11 January 24

Bitcoin / U.S. dollar(BTCUSD) Elliott Wave Technical Analysis 11 January 24

Bitcoin / U.S. dollar(BTCUSD) Elliott Wave Technical Analysis 11 January 24 with Bitcoin and U.S. do...

Read More >

$1 for 2 Weeks

then $29 a month!

What a Special Offer!

Trade Recommendations

Unleash the power of deversified trading with our comprehensive portfolio, covering 250+ markets:

  • Stock Trades
  • Crypto Trades
  • Forex Trades
  • Commodity Trades
Elliott Wave Analysis

Gain a competitive edge with expert insights and AI-powered Elliott Wave charting into:

  • Global Indices
  • US Stocks & ASX Stocks
  • Forex & Crypto
  • Commodities
Top-Notch Trading Tools

Equip yourself with the tools of success:

  • Real-time Chat rooms
  • Elliott Wave Algorithm
  • Portfolio tools
  • TradingLevels
  • Screener
  • Trading Game
7 Elliott Wave Analysts

Stay ahead of the market with daily charts and insightful videos
Your secret to strategic trading!

JOIN HERE


Welcome to TradingLounge (ASIC A.R.No. 321187), specialists in trades, trading education and technical analysis, covering stocks, indices, commodities, forex and cryptocurrencies.

When you join TradingLounge you have access to everything we offer, including trade tools, educational content and a social platform to chat with like-minded investors.

Read more

@Copyright 2024 by tradinglounge.com

Contact Us

Australian no: 02 4787 6020

International no: +61 (2) 47876020

Pay with:

Find us on