12Dec

The Home Depot (HD) Stocks Elliott Wave Technical Analysis: Focusing on its Bullish Momentum and Key Levels at $500 Target

Elliott Wave Analysis: The Home Depot (HD)

This analysis highlights the current trend structure of The Home Depot (HD), leveraging the Elliott Wave Theory on both the daily and 1-hour charts. Below is a comprehensive breakdown of the stock's positioning and possible future trajectories.

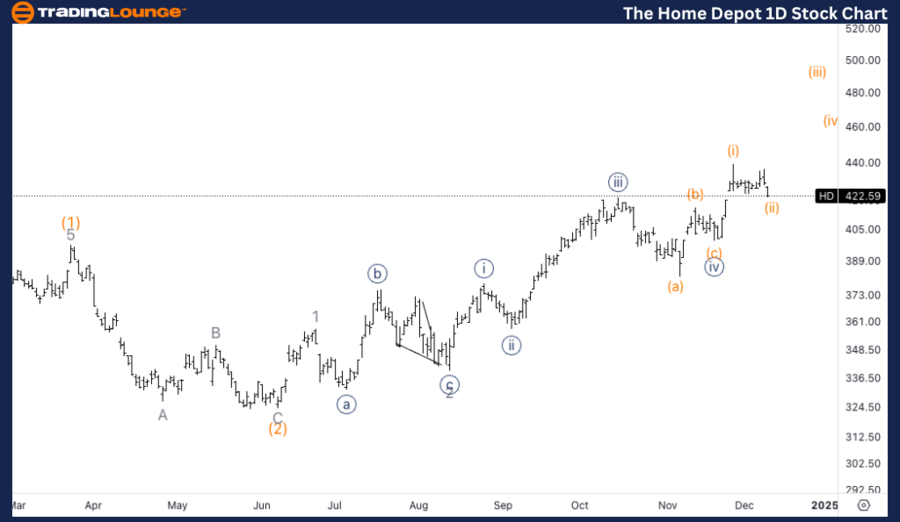
HD Elliott Wave Analysis – TradingLounge Daily Chart

The Home Depot (HD) Daily Chart

HD Elliott Wave Technical Analysis

Function: Trend

Mode: Impulsive

Structure: Motive

Position: Wave {v}

Direction: Upside in wave (iii) of {v} of 3

Details: Anticipating an upward extension in wave {v} toward the next Trading Level of $500.

HD Stock Analysis Summary

The daily chart analysis suggests that HD is progressing within an extended wave {v}, targeting the critical resistance zone at Trading Level $500. The ongoing wave (iii) within wave {v} reflects a robust upward trajectory, confirming strength in the current trend. This projection aligns with the bullish outlook for further upside potential.

The-Home-Depot-1D-St...


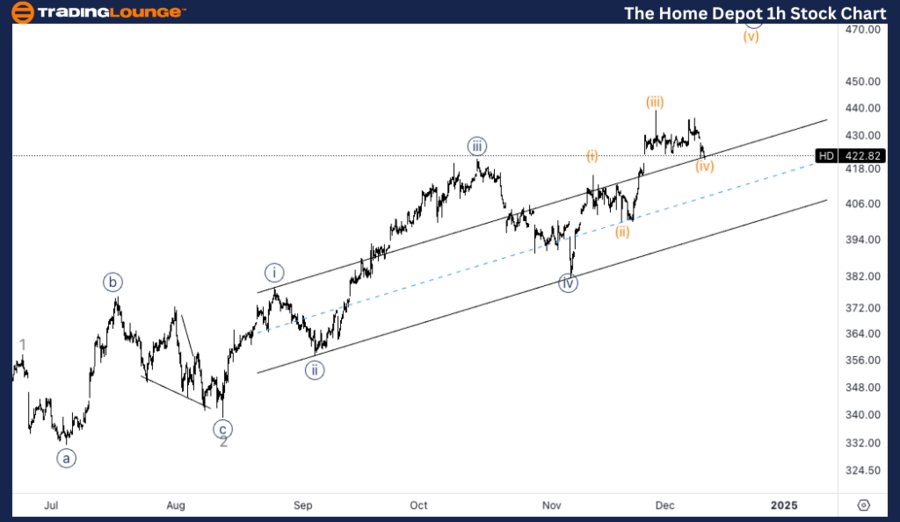
HD Elliott Wave Analysis – TradingLounge 1-Hour Chart

The Home Depot (HD) 1H Chart

HD Stock Technical Analysis

Function: Trend

Mode: Impulsive

Structure: Motive

Position: Wave (iv) of {v}

Direction: Upside in wave {v}

Details: Alternate scenario identifies a bottom in wave {iv} at $380, followed by a five-wave move unfolding into wave {v} on the upside.

The Home Depot Stock Analysis Summary

The 1-hour chart provides an alternate view, indicating that wave {iv} has likely established a bottom at $380. This paves the way for a five-wave move within wave {v}, supporting the bullish sentiment of continued upward movement. This scenario reinforces the trend outlook that HD is positioned to climb further.

Technical Analyst: Alessio Barretta

Source: visit Tradinglounge.com and learn From the Experts Join TradingLounge Here 

See Previous: FTNT Elliott Wave Technical Analysis 

VALUE Offer - Buy 1 Month & Get 3 Months!Click here

Access 7 Analysts Over 200 Markets Covered. Chat Room With Support

The-Home-Depot-1h-St...


Key Takeaways

  • Daily Chart Focus: Extended wave {v} aiming for $500.
  • 1-Hour Chart View: Wave {iv} bottom at $380, with wave {v} moving higher.
  • Trend Analysis: Both charts confirm an overall bullish trajectory for HD, supported by Elliott Wave structure and technical analysis.

Related

Bovespa Index Elliott Wave Analysis: Bovespa Stock Picks, and a Technical View on Bullish and Bearish Signals in the Index Market

Bovespa Index Elliott Wave Analysis: Bovespa Stock Picks, and a Technical View on Bullish and Bearish Signals in the Index Market

This in-depth guide on Bovespa Index analysis covers essential trading insights, Elliott Wave interp...

Read More >
Euro/ U.S. Dollar (EURUSD) Forex Elliott Wave Technical Analysis: Daily and 4-Hour Chart Insights for Effective Forex Trading

Euro/ U.S. Dollar (EURUSD) Forex Elliott Wave Technical Analysis: Daily and 4-Hour Chart Insights for Effective Forex Trading

This comprehensive EURUSD Elliott Wave Analysis covers both daily and 4-hour charts, offering in-dep...

Read More >
Insurance Australia Group IAG Elliott Wave Analysis Reveals Key Resistance Targets Before Major Decline | ASX Stock Forecast

Insurance Australia Group IAG Elliott Wave Analysis Reveals Key Resistance Targets Before Major Decline | ASX Stock Forecast

Insurance Australia Group (ASX:IAG) is completing a B-wave and setting up for a decline. Forecasts s...

Read More >
WTI Crude Oil Commodity Elliott Wave Technical Analysis Explores the Current Market Trends using Elliott Wave theory

WTI Crude Oil Commodity Elliott Wave Technical Analysis Explores the Current Market Trends using Elliott Wave theory

This detailed WTI Crude Oil analysis explores the current market trends using Elliott Wave theory. W...

Read More >
Analog Devices Inc.(ADI) Stocks Elliott Wave Technical Analysis: Focusing on the daily and 4-hour charts.

Analog Devices Inc.(ADI) Stocks Elliott Wave Technical Analysis: Focusing on the daily and 4-hour charts.

This article provides an in-depth Elliott Wave analysis of Analog Devices Inc. (ADI), focusing on th...

Read More >
Euro/ U.S. Dollar (EURUSD) Elliott Wave Analysis Highlights Bullish Trend with Orange Wave 5 and Gray Wave 3 Driving Price Forecast

Euro/ U.S. Dollar (EURUSD) Elliott Wave Analysis Highlights Bullish Trend with Orange Wave 5 and Gray Wave 3 Driving Price Forecast

EURUSD shows a strong bullish trend as Orange Wave 5 develops within Navy Blue Wave 1. Analysis sugg...

Read More >

$1 for 2 Weeks

then $29 a month!

What a Special Offer!

Trade Recommendations

Unleash the power of deversified trading with our comprehensive portfolio, covering 250+ markets:

  • Stock Trades
  • Crypto Trades
  • Forex Trades
  • Commodity Trades
Elliott Wave Analysis

Gain a competitive edge with expert insights and AI-powered Elliott Wave charting into:

  • Global Indices
  • US Stocks & ASX Stocks
  • Forex & Crypto
  • Commodities
Top-Notch Trading Tools

Equip yourself with the tools of success:

  • Real-time Chat rooms
  • Elliott Wave Algorithm
  • Portfolio tools
  • TradingLevels
  • Screener
  • Trading Game
7 Elliott Wave Analysts

Stay ahead of the market with daily charts and insightful videos
Your secret to strategic trading!

JOIN HERE


Welcome to TradingLounge (ASIC A.R.No. 321187), specialists in trades, trading education and technical analysis, covering stocks, indices, commodities, forex and cryptocurrencies.

When you join TradingLounge you have access to everything we offer, including trade tools, educational content and a social platform to chat with like-minded investors.

Read more

@Copyright 2024 by tradinglounge.com

Contact Us

Australian no: 02 4787 6020

International no: +61 (2) 47876020

Pay with:

Find us on