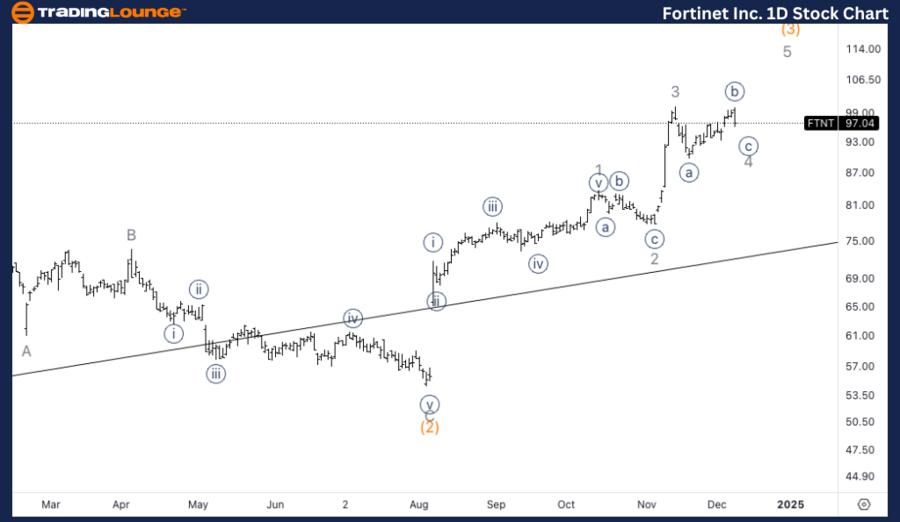
Fortinet Inc. (FTNT) Elliott Wave Analysis – Trading Lounge Daily Chart
FTNT Elliott Wave Technical Analysis
Function: Trend
Mode: Impulsive
Structure: Motive
Position: Wave (3)
Direction: Upside within Wave 5 of (5)
Details:
Fortinet (FTNT) is nearing a potential bottom in Wave 4 as it approaches Trading Level 1 at $100. This level aligns with the expected completion of Wave 4, suggesting that further upside may follow as Wave 5 unfolds.
FTNT Elliott Wave Technical Analysis – Daily Chart
Fortinet (FTNT) appears to be advancing within Wave 5 of (5). The price is finding strong support near Trading Level 1 at $100, which aligns with the likely completion of Wave 4. Once a bottom in Wave 4 is confirmed, the analysis points to upward momentum as Wave 5 develops.

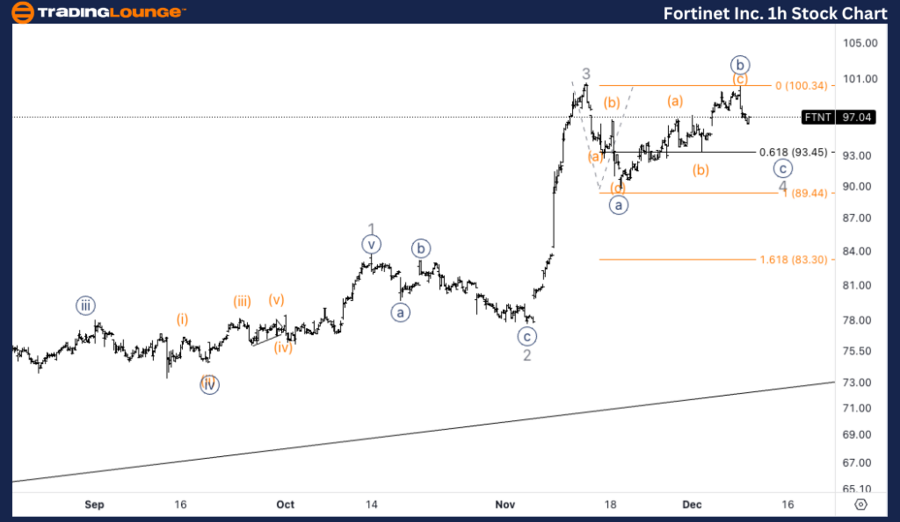
Fortinet Inc. (FTNT) Elliott Wave Technical AnalysisTrading Lounge 1H Chart
Function: Trend
Mode: Impulsive
Structure: Motive
Position: Wave {c} of 4
Direction: Bottom in Wave {c}
Details:
The price is expected to take one more leg lower within Wave 4. Key targets include $89 (equality of {c} vs. {a}) and $93, which represents the 0.618 Fibonacci retracement of {c} vs. {a}. After reaching these levels, a higher turn is anticipated, signaling the start of Wave 5.
FTNT Elliott Wave Technical Analysis – 1H Chart
On the 1-hour chart, Fortinet (FTNT) is completing its corrective phase in Wave {c} of 4. The next downward move is projected to end near $89, achieving equality of {c} vs. {a}, or at $93, which corresponds to the 0.618 Fibonacci retracement. Once these targets are met, an upward trend is likely to begin, initiating the formation of Wave 5.
Technical Analyst: Alessio Barretta
Source: visit Tradinglounge.com and learn From the Experts Join TradingLounge Here
See Previous: Meta Platforms Inc. (META) Elliott Wave Technical Analysis
VALUE Offer - Buy 1 Month & Get 3 Months!Click here
Access 7 Analysts Over 200 Markets Covered. Chat Room With Support
