Coffee Commodity Elliott Wave Analysis
Coffee Elliott Wave Technical Analysis
Coffee prices are regaining upward momentum following a five-week pullback. In the near term, the commodity is set to challenge the 275.1 September 2024 high, aligning with the ongoing long-term bullish sequence.
Long-Term Bullish Path
The current bullish trajectory began in May 2019. The first leg of this pattern (cycle degree wave w) concluded in February 2022, followed by a corrective second leg (cycle degree wave x) ending in January 2023. Since then, the third leg (cycle degree wave y) has been unfolding, already surpassing the February 2022 peak. Projections indicate that cycle degree wave y may extend further, targeting the 317-358 range over the coming weeks or months.
Coffee Commodity Daily Chart Analysis
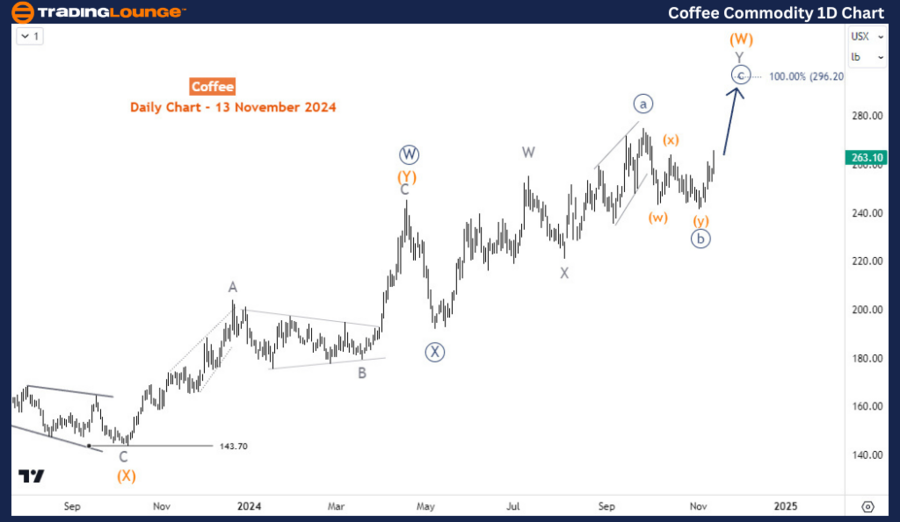
The daily chart highlights the ongoing progress of cycle degree wave y, which began at the 141.85 low in January 2023. This upward movement is forming a double zigzag structure, with the primary degree waves ((W)) and ((X)) completed in April 2024 and May 2024, respectively.
Currently, coffee prices are in wave Y of (W) of ((Y)), with a potential to rise further, possibly reaching 296 before encountering the next significant pullback in wave (X).

Coffee Commodity H4 Chart Analysis
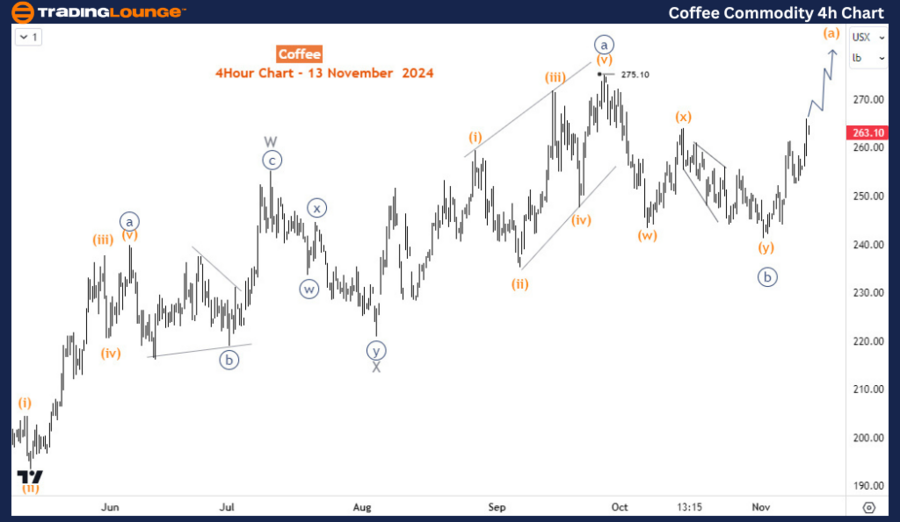
The H4 chart reveals that wave ((b)) of Y of (W) has been completed, and the ongoing rally from November is shaping up as wave (a) of ((c)) of Y of (W). The short-term forecast suggests that this upward momentum may extend to the 296-300 range, making pullbacks an opportunity for traders to consider buy entries.
Technical Analyst: Sanmi Adeagbo
Source: visit Tradinglounge.com and learn From the Experts Join TradingLounge Here
See Previous: GX Uranium ETF Elliott Wave Technical Analysis
VALUE Offer - Buy 1 Month & Get 3 Months!Click here
Access 7 Analysts Over 200 Markets Covered. Chat Room With Support
