BTCUSD Elliott Wave Analysis – TradingLounge Daily Chart
Bitcoin/U.S. Dollar (BTCUSD) Daily Chart Analysis
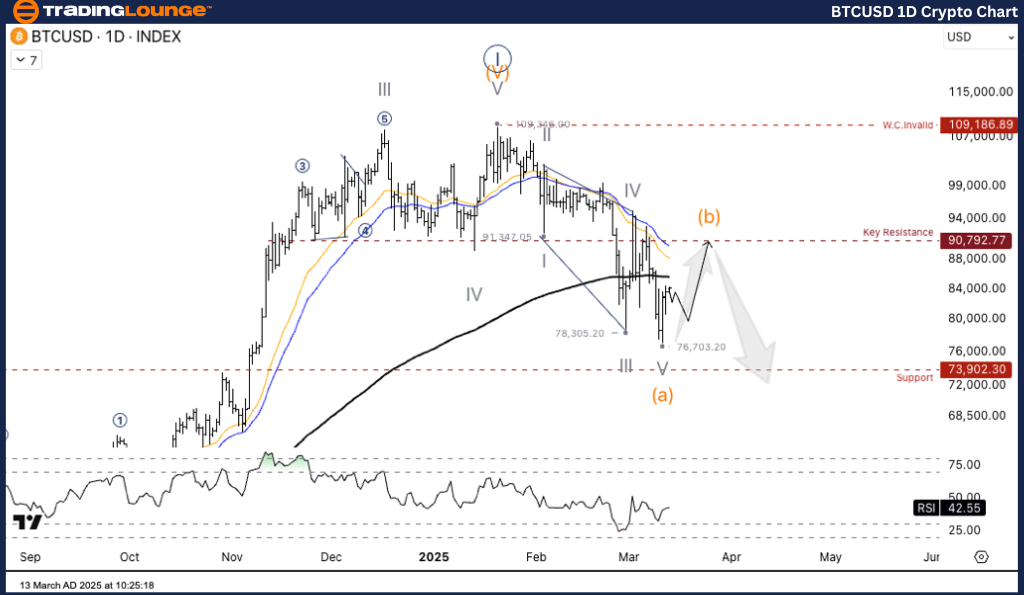
BTCUSD Elliott Wave Technical Analysis
Function: Counter Trend
Mode: Corrective
Structure: Zigzag
Position: Wave (b)
Next Higher Degree Direction: Wave ((II))
Wave Invalidation Level: N/A
BTCUSD Market Overview
Bitcoin (BTC/USD) is undergoing an Elliott Wave correction. The price recently completed Wave A and may now enter Wave B, signaling a short-term recovery before a potential continuation downward into Wave C.
Bitcoin/U.S. Dollar (BTCUSD) Trading Strategy
BTCUSD recently hit a low of $76,703, encountering buying interest. If the price rebounds, it may confirm the beginning of Wave B, a temporary upside correction. However, the $90,792 resistance level remains a key zone to watch. If BTCUSD fails to break above this level, it could indicate a potential reversal.
- Key Resistance: $90,792
- Key Support: $73,902
If BTCUSD faces rejection at $90,792, Wave C could drive prices toward $73,902, a crucial support area. Traders should monitor this price action for potential short-term trading opportunities.
Trading Strategies – BTCUSD Daily Chart
Short-Term Swing Trade Strategy
✅ Sell Opportunity
- If BTC approaches $90,792 and shows signs of reversal, traders may consider opening a short position.
- Risk Management
- If BTC breaks and sustains above $90,792, traders should reassess the Elliott Wave structure, as a new bullish wave could emerge.
BTCUSD Elliott Wave Analysis – TradingLounge H4 Chart
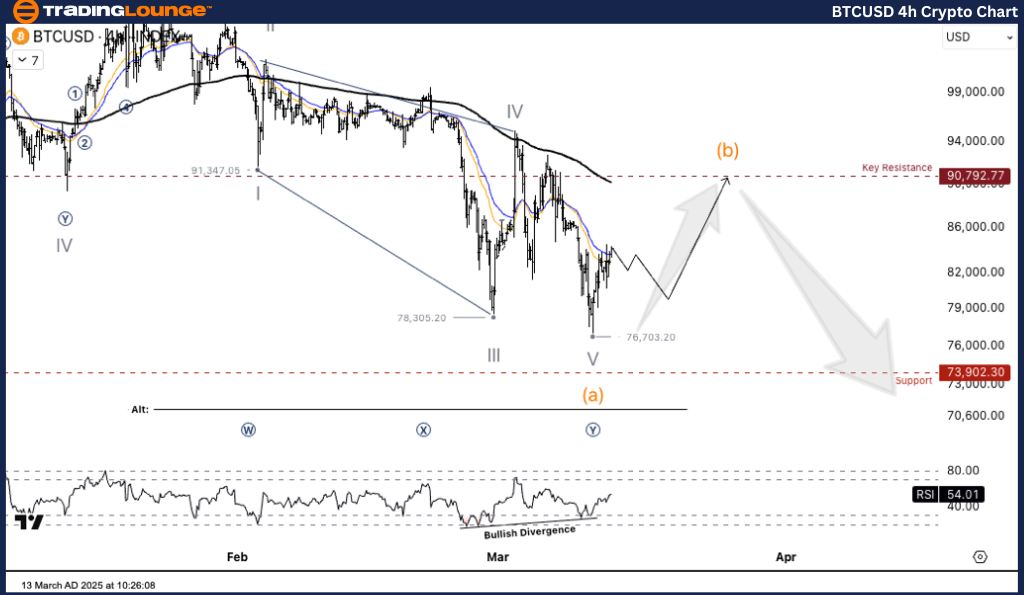
Bitcoin/U.S. Dollar (BTCUSD) Elliott Wave Technical Analysis
Function: Counter Trend
Mode: Corrective
Structure: Zigzag
Position: Wave (b)
Next Higher Degree Direction: Wave ((II))
Wave Invalidation Level: N/A
BTCUSD Market Overview
Bitcoin (BTC/USD) remains in a corrective Elliott Wave pattern. After completing Wave A, price action suggests the beginning of Wave B, which serves as a short-term recovery phase before a likely continuation toward Wave C.
Bitcoin/U.S. Dollar (BTCUSD) Trading Strategy
BTCUSD recently established a $76,703 low, attracting buying interest. If price rebounds, it could signal the start of Wave B. However, a crucial test will occur at the $90,792 resistance level. Failure to break above this point may indicate an impending price reversal.
- Key Resistance: $90,792
- Key Support: $73,902
If BTCUSD fails to hold above $90,792, sellers may push the price toward $73,902, forming a key support area.
Trading Strategies – BTCUSD H4 Chart
Short-Term Swing Trade Strategy
✅ Sell Opportunity
- If BTCUSD nears $90,792 and forms a bearish reversal pattern, traders may consider opening a short position.
- Risk Management
- If BTCUSD decisively breaks and holds above $90,792, traders should reconsider the Elliott Wave count and adjust their market outlook accordingly.
Technical Analyst: Kittiampon Somboonsod
Source: Visit Tradinglounge.com and learn from the Experts. Join TradingLounge Here
Previous: TRXUSD Elliott Wave Technical Analysis
VALUE Offer - Buy 1 Month & Get 3 Months!Click here
Access 7 Analysts Over 200 Markets Covered. Chat Room With Support
Key Takeaways for BTCUSD Traders
- BTCUSD remains in an Elliott Wave corrective phase, currently forming Wave B.
- $90,792 is a crucial resistance level; failure to break it may lead to a Wave C decline.
- Short-term traders should watch for reversal signals at $90,792 for potential short setups.
- A confirmed break above $90,792 could indicate a shift in Elliott Wave structure.
For more Elliott Wave BTCUSD analysis, stay updated with market trends and price action signals.