10Feb

Mastercard (MA) Elliott Wave Technical Analysis: Is a Big Move Coming? Stock Forecast & Trading Insights! Examining Charts

MA Elliott Wave Analysis – Mastercard Inc. (MA)

This Elliott Wave analysis for Mastercard Inc. (MA) evaluates both the daily and 1-hour charts to identify the current market trend, using Elliott Wave Theory to anticipate potential price movements.


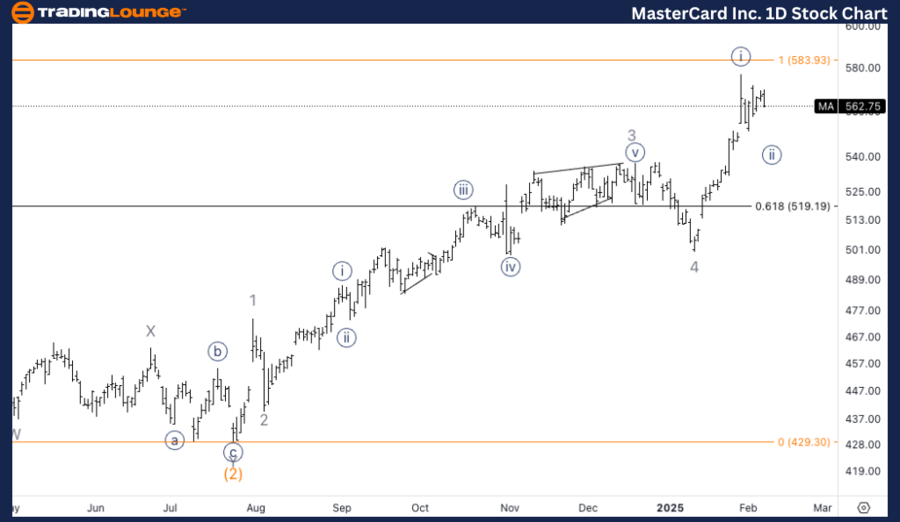
MA Elliott Wave Analysis – TradingLounge Daily Chart

Mastercard Inc. (MA) Daily Chart Analysis

MA Elliott Wave Technical Analysis

Function: Trend

Mode: Impulsive

Structure: Motive

Position: Minor wave 5

Direction: Potential top in wave 5

Analysis Details:

The daily chart suggests further upside potential in wave 5, as the market may be forming wave {ii} of 5. Alternatively, wave 5 of (3) may have already completed, and the market could be preparing for a larger corrective pullback in wave (4). Key resistance levels will be crucial to validate the dominant Elliott Wave count.

Mastercard Inc. (MA) Elliott Wave Forecast – Daily Chart

MA's impulsive structure indicates that minor wave 5 is still developing. There are two potential outcomes:

  • If wave {ii} of 5 is forming, further upside is expected.
  • If wave 5 of (3) has completed, a larger corrective pullback in wave (4) may follow.

Monitoring price action near key resistance levels will help confirm the Elliott Wave scenario.
Mastercard-Inc-1D-st...


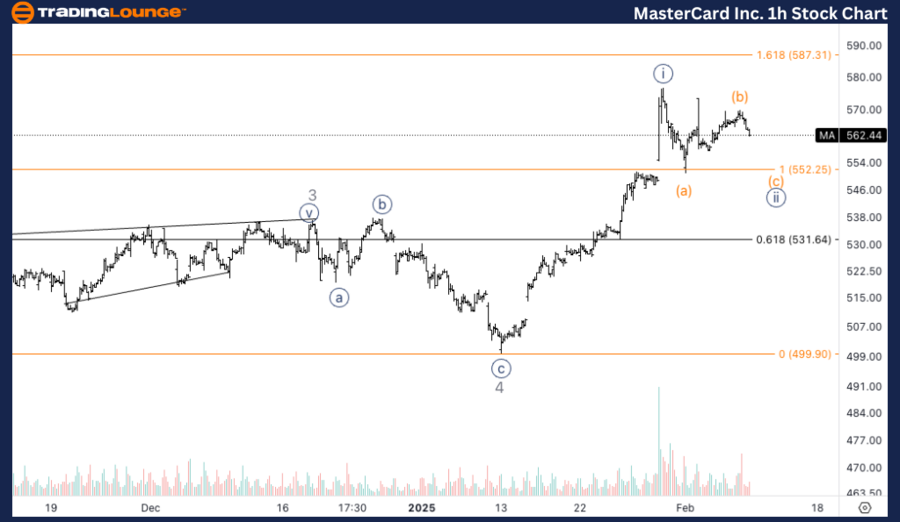
MA Elliott Wave Analysis – TradingLounge 1-Hour Chart

Mastercard Inc. (MA) 1H Chart Analysis

MA Elliott Wave Technical Analysis

Function: Trend

Mode: Impulsive

Structure: Motive

Position: Wave (b) of {ii}

Direction: Downside into wave (c)

Mastercard Inc. Analysis Details:

On the 1-hour chart, wave {i} seems to have reached a peak, and MA is currently correcting in wave {ii}. We are closely watching wave (b) as it nears completion, anticipating a move lower into wave (c). The increase in volume at the recent top may indicate that an alternate count is in play, suggesting that wave 5 has already concluded and a deeper correction is ahead.

Mastercard Inc. (MA) Elliott Wave Forecast – 1H Chart

In the short term:

  • The correction in wave {ii} is still developing.
  • If wave (b) of {ii} is complete, a downside move in wave (c) is expected.
  • The recent volume spike at the top suggests a possible completion of wave 5, signaling a larger correction could be underway.

Technical Analyst: Alessio Barretta

Source: visit Tradinglounge.com and learn From the Experts Join TradingLounge Here 

See Previous: Berkshire Hathaway Inc Elliott Wave Technical Analysis

VALUE Offer - Buy 1 Month & Get 3 Months!Click here

Access 7 Analysts Over 200 Markets Covered. Chat Room With Support

Mastercard-Inc-1h-st...

Related

Stay informed about Wheat Commodity Market with Wheat Elliott Wave Technical Analysis

Stay informed about Wheat Commodity Market with Wheat Elliott Wave Technical Analysis

Our detailed wheat Elliott Wave analysis provides insights into wheat price forecasts and market tre...

Read More >
DOGEUSD Elliott Wave Analysis: Exploring Dogecoin Market Trends, Price Predictions, and Trading Strategies

DOGEUSD Elliott Wave Analysis: Exploring Dogecoin Market Trends, Price Predictions, and Trading Strategies

This detailed DOGEUSD Elliott Wave analysis highlights Dogecoin’s current market trends, focusing o...

Read More >
Euro / U.S. Dollar (EURUSD) Elliott Wave Analysis: Bullish Wave 5 in Focus with Daily and 4-Hour Chart Forecast

Euro / U.S. Dollar (EURUSD) Elliott Wave Analysis: Bullish Wave 5 in Focus with Daily and 4-Hour Chart Forecast

EURUSD Elliott Wave analysis provides a comprehensive breakdown of the current bullish wave structur...

Read More >
Expert NASDAQ Index Elliott Wave Technical Analysis & NDX Analysis: Composite Top Trading Tips and Stock Picks

Expert NASDAQ Index Elliott Wave Technical Analysis & NDX Analysis: Composite Top Trading Tips and Stock Picks

Stay ahead in the market with this comprehensive guide to NASDAQ Composite trading and Elliott Wave ...

Read More >
NIFTY 50 Elliott Wave Technical Analysis: Expanded Flat Correction Nears 25,000-25,100, Key Support at 22,700

NIFTY 50 Elliott Wave Technical Analysis: Expanded Flat Correction Nears 25,000-25,100, Key Support at 22,700

The NIFTY 50 Index is currently in a corrective wave phase, moving towards 25,000-25,100 as part of ...

Read More >
Nifty 50 Elliott Wave Analysis Reveals Bullish Trend With Wave 3 Advancing on Day and Weekly Charts

Nifty 50 Elliott Wave Analysis Reveals Bullish Trend With Wave 3 Advancing on Day and Weekly Charts

Nifty 50 is currently in a bullish impulsive phase, with Orange Wave 3 advancing on both daily and w...

Read More >

$1 for 2 Weeks

then $29 a month!

What a Special Offer!

Trade Recommendations

Unleash the power of deversified trading with our comprehensive portfolio, covering 250+ markets:

  • Stock Trades
  • Crypto Trades
  • Forex Trades
  • Commodity Trades
Elliott Wave Analysis

Gain a competitive edge with expert insights and AI-powered Elliott Wave charting into:

  • Global Indices
  • US Stocks & ASX Stocks
  • Forex & Crypto
  • Commodities
Top-Notch Trading Tools

Equip yourself with the tools of success:

  • Real-time Chat rooms
  • Elliott Wave Algorithm
  • Portfolio tools
  • TradingLevels
  • Screener
  • Trading Game
7 Elliott Wave Analysts

Stay ahead of the market with daily charts and insightful videos
Your secret to strategic trading!

JOIN HERE


Welcome to TradingLounge (ASIC A.R.No. 321187), specialists in trades, trading education and technical analysis, covering stocks, indices, commodities, forex and cryptocurrencies.

When you join TradingLounge you have access to everything we offer, including trade tools, educational content and a social platform to chat with like-minded investors.

Read more

@Copyright 2024 by tradinglounge.com

Contact Us

Australian no: 02 4787 6020

International no: +61 (2) 47876020

Pay with:

Find us on