21Mar

Bitcoin Elliott Wave Analysis: BTCUSD Forecast Shows Corrective Wave b, Key Resistance at $90,792, and Short-Term Trading Strategy Insights

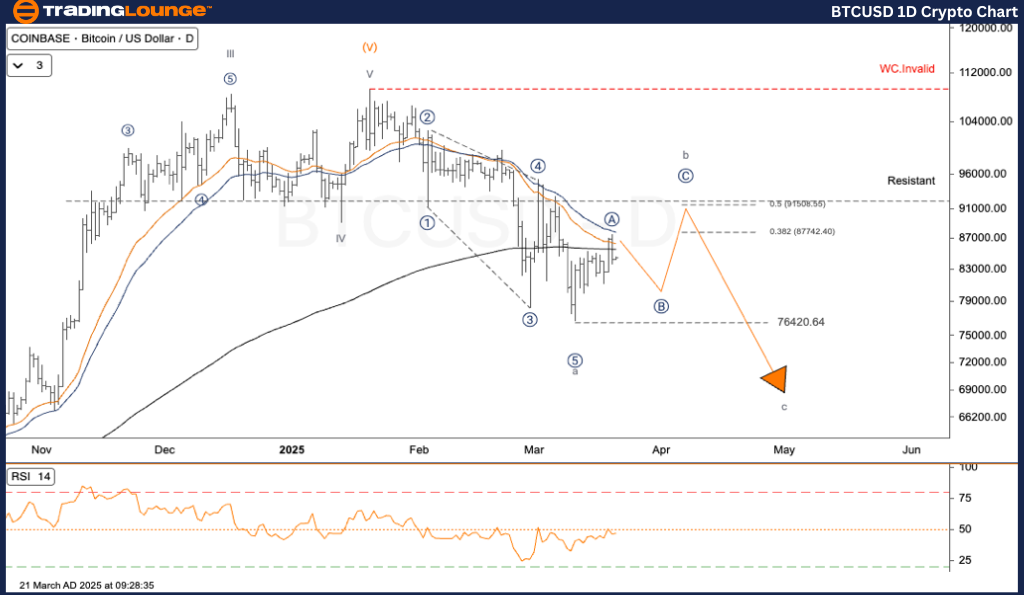
Bitcoin / U.S. Dollar (BTCUSD) Elliott Wave Analysis – TradingLounge Daily Chart 

BTCUSD Elliott Wave Technical Overview

Function: Counter Trend

Mode: Corrective

Structure: Zigzag

Position: Wave b

Next Higher Degree Direction: Wave ((II))

Wave Cancellation Level: Not specified

Details:
Bitcoin (BTC/USD) is navigating a corrective Elliott Wave formation. The completion of Wave A sets the stage for a short-term price increase in Wave B. This rebound is expected before a probable continuation lower into Wave C.

Bitcoin / U.S. Dollar (BTCUSD) Trading Strategy
BTCUSD has rebounded mildly after finalizing Wave (a). Elliott Wave principles suggest the market is entering Wave (b), which historically leads into another downward leg. Traders should focus on the $90,792 resistance level, which could act as a significant pivot point. The bearish trend completed Wave ((5)) near $76,703. Current movement indicates sub-wave a of (b) has likely ended, with wave b of (b) unfolding.

  • Key Resistance: $90,792

If BTCUSD remains under this resistance, a decline toward wave c of (b) is likely, followed by a possible continuation into wave (c).

Trading Strategies

  • Strategy

✅ For Short-Term Traders (Swing Trade)
If BTCUSD retests the $90,792 level and encounters resistance, traders may consider short positions aligned with the anticipated move in wave (c).

  • Risk Management:

A price move above $111,954 invalidates the current wave scenario and signals the need for a revised analysis.

BTCUSD-1d-crypto-cha...


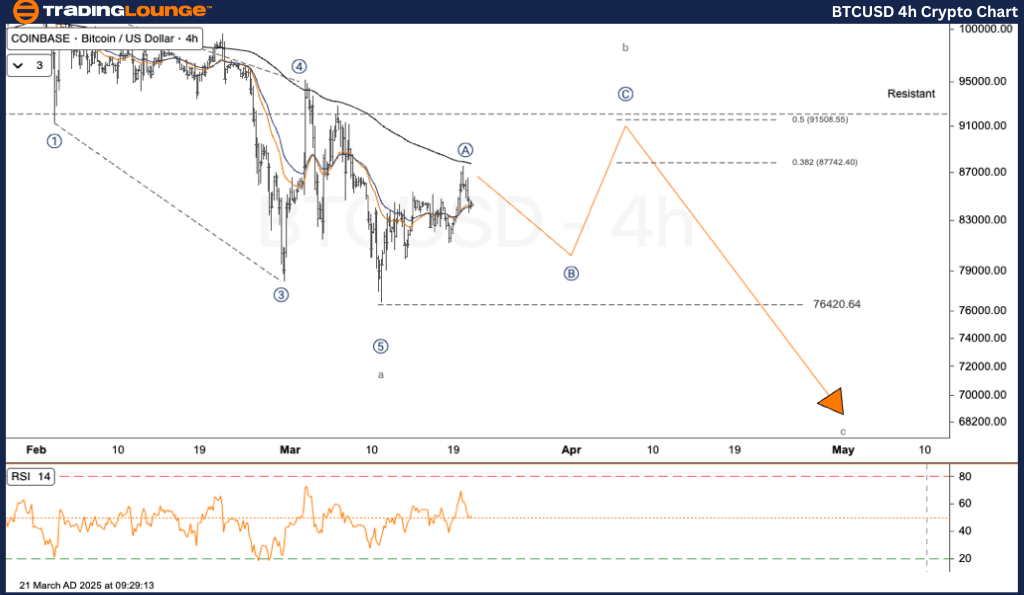
Bitcoin / U.S. Dollar (BTCUSD) Elliott Wave Analysis – TradingLounge H4 Chart |

BTCUSD Elliott Wave Technical Overview

Function: Counter Trend

Mode: Corrective

Structure: Zigzag

Position: Wave b

Next Higher Degree Direction: Wave ((II))

Wave Cancellation Level: Not specified

Details:
Bitcoin (BTC/USD) remains within a corrective Elliott Wave zigzag. Following the conclusion of Wave A, the market appears to be in the early stages of Wave B — a temporary rally — ahead of a projected decline into Wave C.

Bitcoin / U.S. Dollar (BTCUSD) Trading Strategy
BTC is recovering slightly from wave (a), and wave (b) is now in progress as per the Elliott Wave framework. Watch the $90,792 resistance carefully, as it may dictate short-term market direction. The downtrend terminated with wave ((5)) at $76,703. Currently, price action implies wave b of (b) is forming, following the end of sub-wave a.

  • Key Resistance: $90,792

Failure to overcome this resistance may lead to a sharp drop in wave c of (b), and possibly wave (c) afterwards.

Trading Strategies

  • Strategy

✅ For Short-Term Traders (Swing Trade)
A rejection near $90,792 resistance could offer a shorting setup in sync with the next bearish leg in wave (c).

  • Risk Management:

If BTCUSD breaks above $111,954, the bearish Elliott Wave pattern becomes invalid, requiring updated analysis.

Technical Analyst: Kittiampon Somboonsod

Source: Visit Tradinglounge.com and learn from the Experts. Join TradingLounge Here 

Previous: AAVEUSD Elliott Wave Technical Analysis

VALUE Offer - Buy 1 Month & Get 3 Months!Click here

Access 7 Analysts Over 200 Markets Covered. Chat Room With Support

BTCUSD-4h-crypto-cha...

Related

NEWMONT CORPORATION - NEM Elliott Wave Technical Analysis Reveals Bullish Impulse Wave With Key Targets and Invalidation Levels

NEWMONT CORPORATION - NEM Elliott Wave Technical Analysis Reveals Bullish Impulse Wave With Key Targets and Invalidation Levels

Elliott Wave forecast on Newmont Corporation (ASX:NEM). Review the short and long-term wave structur...

Read More >
The Boeing Company (BA) Stock Analysis: Elliott Wave Forecast Predicts Bullish Breakout with BA Price Target of $200

The Boeing Company (BA) Stock Analysis: Elliott Wave Forecast Predicts Bullish Breakout with BA Price Target of $200

The Boeing stock forecast provides a comprehensive Elliott Wave analysis, covering both daily and 1-...

Read More >
Vanguard Australian Shares: V300AEQ ETF UNITS – VAS Stock Analysis & VAS Elliott Wave Technical Forecast

Vanguard Australian Shares: V300AEQ ETF UNITS – VAS Stock Analysis & VAS Elliott Wave Technical Forecast

This article provides an in-depth Elliott Wave analysis of ASX: V300AEQ ETF UNITS - VAS, highlightin...

Read More >
Comprehensive VETUSD Elliott Wave Technical Analysis: Vechain Price Forecast, Trends, and Trading Strategies

Comprehensive VETUSD Elliott Wave Technical Analysis: Vechain Price Forecast, Trends, and Trading Strategies

This VETUSD Elliott Wave analysis provides a comprehensive look at Vechain’s current price trends, ...

Read More >
Insights into the Current Trends in the ASX Market: ASX LIMITED Stock Analysis & ASX Elliott Wave Technical Forecast

Insights into the Current Trends in the ASX Market: ASX LIMITED Stock Analysis & ASX Elliott Wave Technical Forecast

This article provides an in-depth Elliott Wave analysis of ASX Limited, focusing on its potential pr...

Read More >
Polkadot/U.S. dollar(DOTUSD) Elliott Wave Technical Analysis 19 October 23

Polkadot/U.S. dollar(DOTUSD) Elliott Wave Technical Analysis 19 October 23

DOTUSD Elliott Wave Analysis TradingLounge Daily and 4-hour Chart for 19 October 23.

Read More >

$1 for 2 Weeks

then $29 a month!

What a Special Offer!

Trade Recommendations

Unleash the power of deversified trading with our comprehensive portfolio, covering 250+ markets:

  • Stock Trades
  • Crypto Trades
  • Forex Trades
  • Commodity Trades
Elliott Wave Analysis

Gain a competitive edge with expert insights and AI-powered Elliott Wave charting into:

  • Global Indices
  • US Stocks & ASX Stocks
  • Forex & Crypto
  • Commodities
Top-Notch Trading Tools

Equip yourself with the tools of success:

  • Real-time Chat rooms
  • Elliott Wave Algorithm
  • Portfolio tools
  • TradingLevels
  • Screener
  • Trading Game
7 Elliott Wave Analysts

Stay ahead of the market with daily charts and insightful videos
Your secret to strategic trading!

JOIN HERE


Welcome to TradingLounge (ASIC A.R.No. 321187), specialists in trades, trading education and technical analysis, covering stocks, indices, commodities, forex and cryptocurrencies.

When you join TradingLounge you have access to everything we offer, including trade tools, educational content and a social platform to chat with like-minded investors.

Read more

@Copyright 2024 by tradinglounge.com

Contact Us

Australian no: 02 4787 6020

International no: +61 (2) 47876020

Pay with:

Find us on