Welcome to Our Latest Elliott Wave Analysis for McDonald’s Corp. (MCD)

This Elliott Wave analysis delves into McDonald's Corp. (MCD) price action, offering traders insights into potential trading opportunities by examining current trends and market structure. We will review both daily and 1-hour charts to provide a thorough understanding of MCD's market behavior.

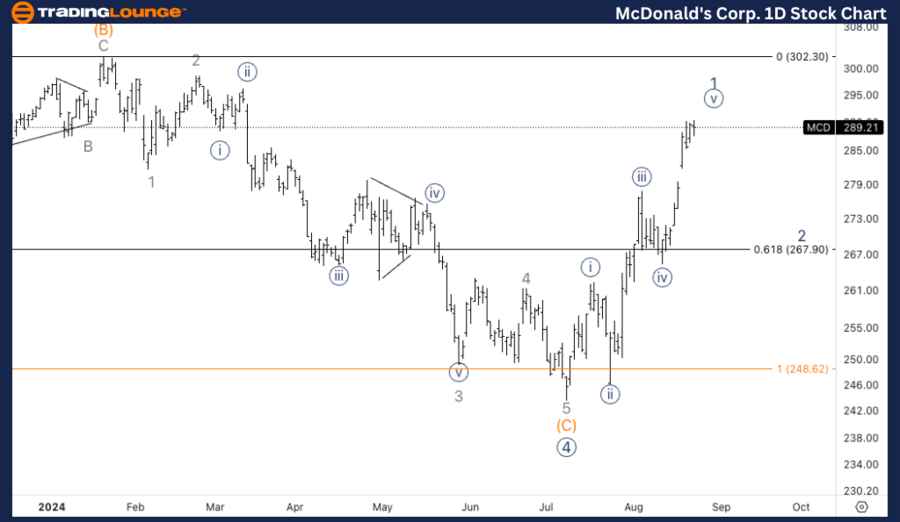
MCD Elliott Wave Analysis - Trading Lounge Daily Chart

McDonald’s Corp. (MCD) Daily Chart Analysis

MCD Elliott Wave Technical Analysis

  • FUNCTION: Trend
  • MODE: Impulsive
  • STRUCTURE: Motive
  • POSITION: Wave 1 of (1)
  • DIRECTION: Upside into wave 1

DETAILS: Anticipating a potential peak in wave 1 or (1) of Primary wave 5. Resistance may be encountered around the $300 mark (TL3), where a pullback in wave 2 or (2) could occur.

MCD Stock Technical Analysis – Daily Chart Insight

MCD is progressing in wave 1 or (1) of the larger Primary wave 5. The price action indicates that a potential top for this wave is near, with the $300 level (TL3) serving as a crucial resistance point. As the price approaches this resistance, traders should be vigilant for a potential reversal, as wave 2 or (2) might initiate a corrective phase. This is a critical level where traders should prepare for possible shifts in market dynamics.
McDonalds-Corp-1D-St...


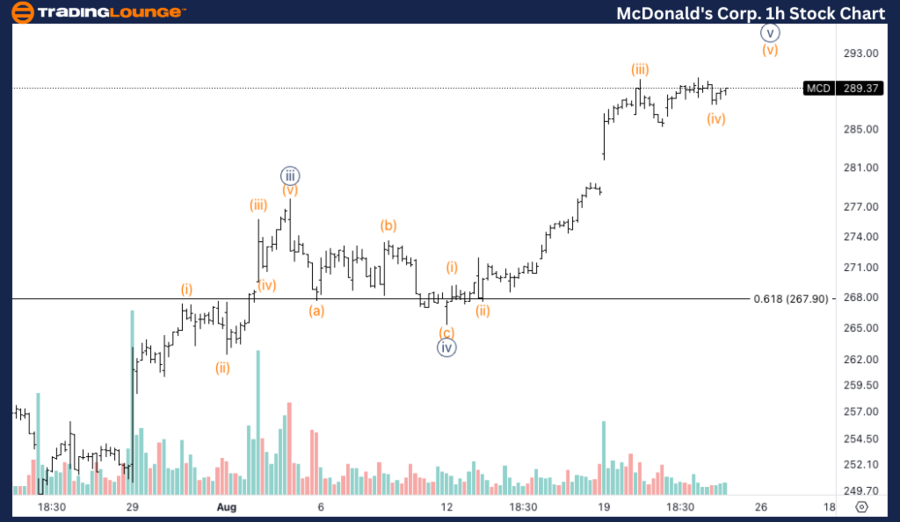
MCD Elliott Wave Analysis - Trading Lounge 1H Chart

McDonald’s Corp. (MCD) 1H Chart Analysis

MCD Elliott Wave Technical Analysis

  • FUNCTION: Trend
  • MODE: Impulsive
  • STRUCTURE: Motive
  • POSITION: Wave {v} of 1
  • DIRECTION: Upside in wave {v}

DETAILS: A clear subdivision within wave {v} suggests the current uptrend is still intact, with at least one more upward movement likely, potentially reaching the $300 level. Volume analysis also supports this continuation.

MCD Stock Technical Analysis – 1H Chart

On the 1-hour chart, a clear subdivision within wave {v} of 1 indicates that the uptrend remains incomplete. Another leg higher is expected, which could push the price towards the $300 level. Volume patterns align with this projection, showing sustained buying interest that might drive the price to the $300 target before any significant correction begins.

Technical Analyst: Alessio Barretta

Source: visit Tradinglounge.com and learn From the Experts Join TradingLounge Here 

See Previous: Advanced Micro Devices Inc Elliott Wave Technical Analysis

Special Trial Offer - 0.76 Cents a Day for 3 Months! Click here

Access 7 Analysts Over 200 Markets Covered. Chat Room With Support
McDonalds-Corp-1h-St...

Related

Elliott Wave Technical  Analysis of Visa Inc. (V) that provides in-depth insights into stock Market trends

Elliott Wave Technical Analysis of Visa Inc. (V) that provides in-depth insights into stock Market trends

Discover a detailed Elliott Wave analysis of Visa Inc. (V) that provides in-depth insights into stoc...

Read More >
IBEX 35 (Spain) Elliott Wave Technical Analysis: Key Trends, Wave Patterns, and Trading Insights

IBEX 35 (Spain) Elliott Wave Technical Analysis: Key Trends, Wave Patterns, and Trading Insights

The IBEX 35 Elliott Wave analysis provides actionable insights into the Spanish stock index's pr...

Read More >
Market dynamics: Microsoft Inc.(MSFT) Elliott Wave Technical Analysis Insights

Market dynamics: Microsoft Inc.(MSFT) Elliott Wave Technical Analysis Insights

Our Elliott Wave analysis of Microsoft Inc. (MSFT), reveals a counter-trend sentiment with correctiv...

Read More >
Visa Inc. (V) Elliott Wave Technical Analysis: Daily and 4Hr Chart Insights 8 February 24

Visa Inc. (V) Elliott Wave Technical Analysis: Daily and 4Hr Chart Insights 8 February 24

Delve into the intricate world of Visa Inc. (V) with our expert Elliott Wave analysis dated 8 Februa...

Read More >
Mastering Bitcoin/ U.S. dollar(BTCUSD) Elliott Wave Technical Analysis for Profitable Trading

Mastering Bitcoin/ U.S. dollar(BTCUSD) Elliott Wave Technical Analysis for Profitable Trading

As of February 29, 2024, leverage the insights from TradingLounge's daily and 4-hour BTCUSD char...

Read More >
In-Depth Elliott Wave Technical  Analysis and Strategic Price Forecast:Copper Commodity

In-Depth Elliott Wave Technical Analysis and Strategic Price Forecast:Copper Commodity

Delve into our in-depth Copper Elliott Wave analysis for June 2024. This report provides a thorough ...

Read More >

Buy 1 Month

Get 3 Months!

Special Offer:

Trade Recommendations

Unleash the power of deversified trading with our comprehensive portfolio, covering:

  • Stock Trades
  • Crypto Trades
  • Forex Trades
  • Commodity Trades
Elliott Wave Analysis

Gain a competive edge with expert insights in to:

  • Global Indices
  • US Stocks & ASX Stocks
  • Forex & Crypto
  • Commodities
Top-Notch Trading Tools

Equip yourself with the tools of success:

  • Social Chat
  • Elliott Wave Algorithm
  • Screener
  • TradingLevels
  • Trading Game
7 Elliott Wave Analysts

Stay ahead of the market with daily charts and insightful videos
-Your secret to strategic trading!

JOIN HERE


Welcome to TradingLounge (ASIC A.R.No. 321187), specialists in trades, trading education and technical analysis, covering stocks, indices, commodities, forex and cryptocurrencies.

When you join TradingLounge you have access to everything we offer, including trade tools, educational content and a social platform to chat with like-minded investors.

Read more

@Copyright 2024 by tradinglounge.com

Contact Us

Australian no: 02 4787 6020

International no: +61 (2) 47876020

Pay with:

Find us on