17Sep

Unlocking ASX Trading Success: BRAMBLES LIMITED - BXB Stock Analysis & Elliott Wave Technical Forecast

ASX: BRAMBLES LIMITED – BXB Elliott Wave Technical Analysis (1D Chart)

Greetings, today's Elliott Wave analysis focuses on the Australian Stock Exchange (ASX) and BRAMBLES LIMITED - BXB. Our analysis suggests that BXB may continue its upward movement, supported by the v-grey wave.

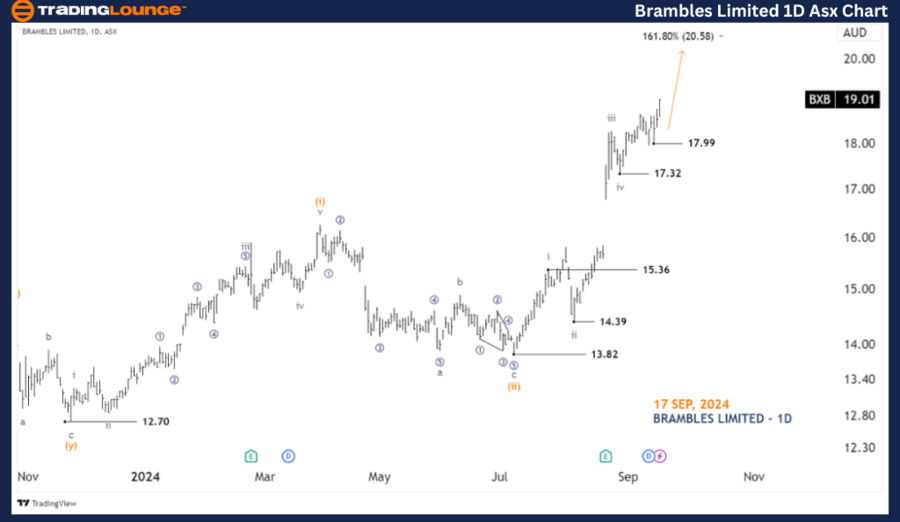
ASX: BRAMBLES LIMITED - BXB 1D Chart (Semilog Scale) Analysis

BXB Elliott Wave Technical Analysis

Function: Major trend (Minuette degree, orange)

Mode: Motive

Structure: Impulse

Position: Wave v-grey of Wave (iii)-orange

Details: Wave iv has recently concluded, and wave v-grey appears to be unfolding with a potential extension higher. The target is set at 20.58, provided the price stays above 17.99. If the price falls below this point, our view will be invalidated.

Invalidation point: 17.99

BRAMBLES-LIMITED-1D-...


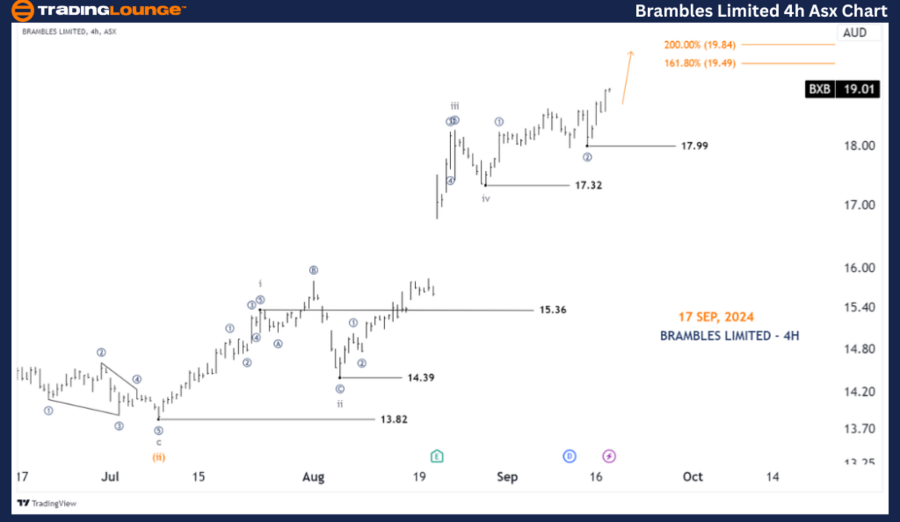
ASX: BRAMBLES LIMITED - BXB 4-Hour Chart Analysis

BXB Elliott Wave Technical Analysis

Function: Major trend (Minute degree, navy)

Mode: Motive

Structure: Impulse

Position: Wave ((3))-navy of Wave v-grey

Details: The v-grey wave is extending, with the first two waves ((1))-navy and ((2))-navy already complete. The current wave, ((3))-navy, seems to be unfolding, aiming for the highs of 19.49 - 19.84. A break above these levels would confirm further upward movement, potentially targeting 20.58. The price must hold above 17.99 for this analysis to remain valid.

Invalidation point: 17.99

Conclusion:

This analysis of ASX: BRAMBLES LIMITED - BXB highlights potential trends and key price levels for traders. We provide specific validation and invalidation points to support our wave count, helping enhance confidence in this forecast. By merging these factors, we aim to offer readers a professional and objective view of the current market trends.

Technical Analyst: Hua (Shane) Cuong, CEWA-M (Master’s Designation).

Source: visit Tradinglounge.com and learn From the Experts Join TradingLounge Here 

See Previous: Woolworths Group Limited Elliott Wave Technical Analysis 

Special Trial Offer - 0.76 Cents a Day for 3 Months! Click here

Access 7 Analysts Over 200 Markets Covered. Chat Room With Support

BRAMBLES-LIMITED-4H-...

Related

S&P/TSX 60 Index Elliott Wave Analysis: Market Trends, Forecast, Market Movements with this Comprehensive Technical Analysis

S&P/TSX 60 Index Elliott Wave Analysis: Market Trends, Forecast, Market Movements with this Comprehensive Technical Analysis

This analysis provides a detailed Elliott Wave forecast for the S&P/TSX 60 index, covering the lates...

Read More >
Highlights Polkadot’s Bearish Momentum and Key Market Indicators: Crypto DOTUSD Elliott Wave Technical Analysis

Highlights Polkadot’s Bearish Momentum and Key Market Indicators: Crypto DOTUSD Elliott Wave Technical Analysis

This comprehensive analysis provides a detailed look at DOTUSD (Polkadot) through Elliott Wave patte...

Read More >
Current Market Movements in U.S. Dollar / Canadian Dollar Currency Pair | USD/CAD Elliott Wave Technical Analysis

Current Market Movements in U.S. Dollar / Canadian Dollar Currency Pair | USD/CAD Elliott Wave Technical Analysis

This article provides an in-depth USD/CAD Elliott Wave Analysis for both daily and 4-hour charts. It...

Read More >
Stay informed with our expert insights: Visa Inc. (V) Stocks Elliott Wave Technical Analysis

Stay informed with our expert insights: Visa Inc. (V) Stocks Elliott Wave Technical Analysis

Get the latest Elliott Wave analysis for Visa Inc. (V) as of June 13, 2024. Our detailed review cove...

Read More >
Johnson & Johnson (JNJ:NYSE) Elliott Wave Technical Analysis 6 December 23

Johnson & Johnson (JNJ:NYSE) Elliott Wave Technical Analysis 6 December 23

Johnson & Johnson (JNJ:NYSE) Elliott Wave Technical Analysis dated 6 December 23,

Read More >
NEOUSD Elliott Wave Analysis: NEO Trading Strategy, Fibonacci Support Forecast, and Crypto Market Trends for Smart Traders

NEOUSD Elliott Wave Analysis: NEO Trading Strategy, Fibonacci Support Forecast, and Crypto Market Trends for Smart Traders

NEOUSD Elliott Wave analysis, Fibonacci support levels, and swing trading strategies to forecast pri...

Read More >

$1 for 2 Weeks

then $29 a month!

What a Special Offer!

Trade Recommendations

Unleash the power of deversified trading with our comprehensive portfolio, covering 250+ markets:

  • Stock Trades
  • Crypto Trades
  • Forex Trades
  • Commodity Trades
Elliott Wave Analysis

Gain a competitive edge with expert insights and AI-powered Elliott Wave charting into:

  • Global Indices
  • US Stocks & ASX Stocks
  • Forex & Crypto
  • Commodities
Top-Notch Trading Tools

Equip yourself with the tools of success:

  • Real-time Chat rooms
  • Elliott Wave Algorithm
  • Portfolio tools
  • TradingLevels
  • Screener
  • Trading Game
7 Elliott Wave Analysts

Stay ahead of the market with daily charts and insightful videos
Your secret to strategic trading!

JOIN HERE


Welcome to TradingLounge (ASIC A.R.No. 321187), specialists in trades, trading education and technical analysis, covering stocks, indices, commodities, forex and cryptocurrencies.

When you join TradingLounge you have access to everything we offer, including trade tools, educational content and a social platform to chat with like-minded investors.

Read more

@Copyright 2024 by tradinglounge.com

Contact Us

Australian no: 02 4787 6020

International no: +61 (2) 47876020

Pay with:

Find us on