06Dec

Johnson & Johnson (JNJ:NYSE) Elliott Wave Technical Analysis 6 December 23

Johnson & Johnson, Elliott Wave Technical Analysis

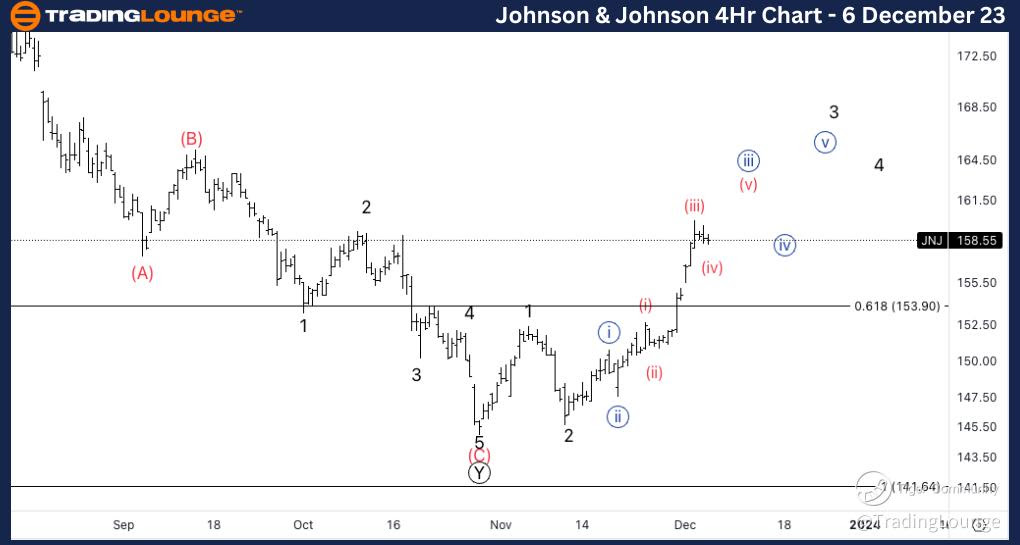
Johnson & Johnson, (JNJ:NYSE): 4h Chart 6 December 23

JNJ Stock Market Analysis: We changed the count to a bullish scenario. At this stage we are looking for upside in either a wave 3 or C that seems to be unfolding as expected. Looking for 5 waves within wave 3/C.

JNJ Elliott Wave Count: Wave (iii) of {iii}.  

JNJ Technical Indicators: Above all averages.

JNJ Trading Strategy: Looking for longs into wave 3.  

TradingLounge Analyst: Alessio Barretta

Source: Tradinglounge.com get trial here!
JNJ-4Hr-Stock-Chart-...


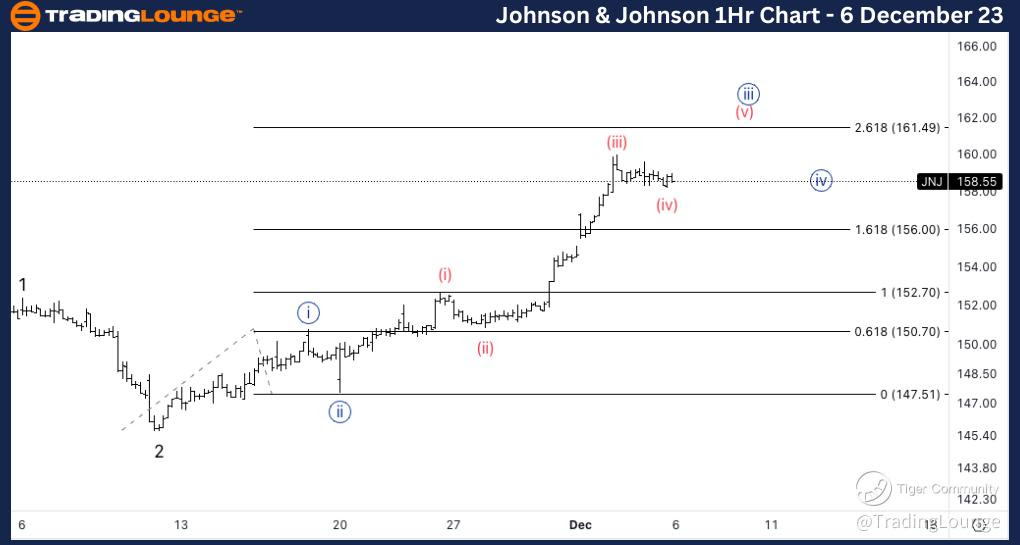
Johnson & Johnson, JNJ: 1-hour Chart 6 December 23

Johnson & Johnson, Elliott Wave Technical Analysis 

JNJ Stock Market Analysis: Looking for a sideways consolidation into wave (iv) to then continue higher as we seem to be finding support on 158$. Upside target for wave {iii} stands at 161.5 as we have 2.618 of {iii} vs. {i}.

JNJ Elliott Wave count:  Wave (iv) of {iii}

JNJ Technical Indicators: Above all averages.

JNJ Trading Strategy: Looking for longs into wave (v).
JNJ-1Hr-Stock-Chart-...

Related

Unlocking ASX Trading Success: TELSTRA GROUP LIMITED - TLS Stock Analysis & Elliott Wave Technical Forecast

Unlocking ASX Trading Success: TELSTRA GROUP LIMITED - TLS Stock Analysis & Elliott Wave Technical Forecast

Dive into the latest Telstra Group Limited (TLS.ASX) analysis with Elliott Wave insights. Learn abou...

Read More >
Elliott Wave Trading Strategies: SP500, NASDAQ 100, DAX 40, FTSE 100, ASX 200 – Daily Market Forecast

Elliott Wave Trading Strategies: SP500, NASDAQ 100, DAX 40, FTSE 100, ASX 200 – Daily Market Forecast

This blog provides updated Elliott Wave technical analysis and trading strategies for the SP500, NAS...

Read More >
EUR/USD Elliott Wave Analysis Reveals Bullish Impulse Pattern Suggesting Continued Uptrend in Forex Market

EUR/USD Elliott Wave Analysis Reveals Bullish Impulse Pattern Suggesting Continued Uptrend in Forex Market

The EUR/USD pair exhibits a bullish impulsive pattern according to Elliott Wave analysis, indicating...

Read More >
Comprehensive Insights on ASX LIMITED - ASX Stock Analysis & Elliott Wave Technical Forecast

Comprehensive Insights on ASX LIMITED - ASX Stock Analysis & Elliott Wave Technical Forecast

Stay updated with comprehensive insights on ASX Limited stock. Explore the current stock price, deta...

Read More >
Master the Market: Elliott Wave Analysis for SP500, NASDAQ 100, RUSSELL 2000, DAX 40, FTSE 100, ASX 200

Master the Market: Elliott Wave Analysis for SP500, NASDAQ 100, RUSSELL 2000, DAX 40, FTSE 100, ASX 200

Stock Market Indices Overview: S&P 500, SPY, NASDAQ 100, QQQ, RUSSELL 2000, DAX 40, FTSE 100, ASX 20...

Read More >

$1 for 2 Weeks

then $29 a month!

What a Special Offer!

Trade Recommendations

Unleash the power of deversified trading with our comprehensive portfolio, covering 250+ markets:

  • Stock Trades
  • Crypto Trades
  • Forex Trades
  • Commodity Trades
Elliott Wave Analysis

Gain a competitive edge with expert insights and AI-powered Elliott Wave charting into:

  • Global Indices
  • US Stocks & ASX Stocks
  • Forex & Crypto
  • Commodities
Top-Notch Trading Tools

Equip yourself with the tools of success:

  • Real-time Chat rooms
  • Elliott Wave Algorithm
  • Portfolio tools
  • TradingLevels
  • Screener
  • Trading Game
7 Elliott Wave Analysts

Stay ahead of the market with daily charts and insightful videos
Your secret to strategic trading!

JOIN HERE


Welcome to TradingLounge (ASIC A.R.No. 321187), specialists in trades, trading education and technical analysis, covering stocks, indices, commodities, forex and cryptocurrencies.

When you join TradingLounge you have access to everything we offer, including trade tools, educational content and a social platform to chat with like-minded investors.

Read more

@Copyright 2024 by tradinglounge.com

Contact Us

Australian no: 02 4787 6020

International no: +61 (2) 47876020

Pay with:

Find us on