S&P/TSX 60 Daily Chart – Elliott Wave Forecast & Technical Analysis
S&P/TSX 60 Elliott Wave Technical Analysis
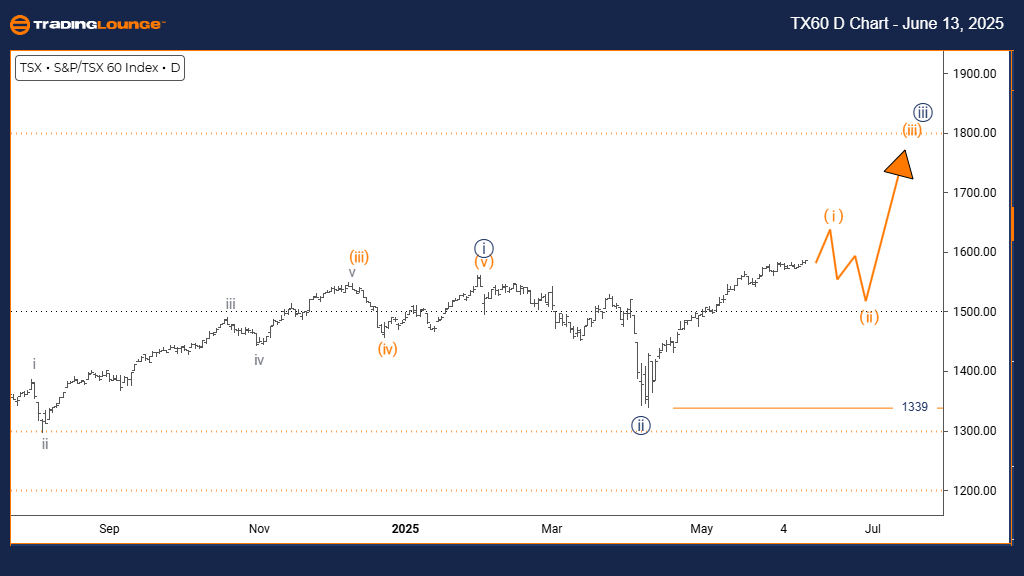
FUNCTION: Bullish Trend
MODE: Impulsive
STRUCTURE: Orange wave 1
POSITION: Navy blue wave 3
DIRECTION NEXT LOWER DEGREES: Orange wave 2
DETAILS: Navy blue wave 2 completed; orange wave 1 of 3 unfolding
Wave Invalidation Level: 1339
This S&P/TSX 60 daily Elliott Wave analysis indicates a clear bullish trend, with impulsive price movement reflecting the early stages of a broader market advance. The chart outlines orange wave 1 forming within a larger navy blue wave 3, pointing to increasing momentum and potential for long-term gains.
The confirmation of navy blue wave 2's completion marks the onset of orange wave 1, suggesting continued bullish sentiment. A corrective orange wave 2 is expected next, which typically presents a short-term pullback within a rising trend. The forecast remains valid as long as the index stays above the critical invalidation level at 1339, reinforcing the upward Elliott Wave structure.
S&P/TSX 60 Weekly Chart – Elliott Wave Forecast & Technical Analysis
FUNCTION: Bullish Trend
MODE: Impulsive
STRUCTURE: Navy blue wave 3
POSITION: Gray wave 3
DIRECTION NEXT LOWER DEGREES: Navy blue wave 4
DETAILS: Navy blue wave 2 completed; navy blue wave 3 of 3 in progress
Wave Invalidation Level: 1339
The weekly Elliott Wave analysis for S&P/TSX 60 continues to confirm a bullish market structure, with the index advancing through navy blue wave 3, which is part of the broader gray wave 3. This phase often represents the strongest move within the Elliott sequence, featuring sharp, sustained rallies.
Following the completion of navy blue wave 2, the market is currently driving higher within navy blue wave 3 of 3, indicating strong upward pressure. Once this segment completes, a pullback via navy blue wave 4 is anticipated. As long as price holds above the wave invalidation level at 1339, the Elliott Wave forecast supports further upside in the medium term.
Technical Analyst: Malik Awais
Source: Visit Tradinglounge.com and learn from the Experts. Join TradingLounge Here
Previous: GBPAUD Elliott Wave Technical Analysis
VALUE Offer - $1 for 2 Weeks then $29 a month!Click here
Access 7 Analysts Over 200 Markets Covered. Chat Room With Support