22Oct

Expert insights into Coles Group's stock performance: Coles Group Limited Stock Analysis & COL Elliott Wave Technical Forecast

TradingLounge ASX: Coles Group Limited Stock Analysis - 1D Chart

Introduction

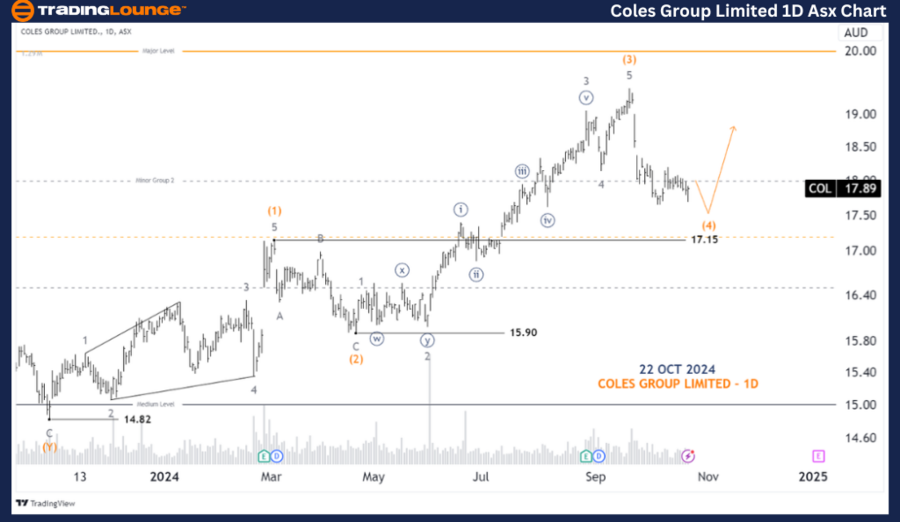
Our updated Elliott Wave analysis focuses on COLES GROUP LIMITED (COL) listed on the Australian Stock Exchange (ASX). We foresee a potential short-term rally for COL, followed by a pullback to lower price levels.

ASX: COLES GROUP LIMITED (COL) 1D Chart (Semilog Scale)

COL Elliott Wave Technical Analysis

Function: Major trend (Minute degree, navy)

Mode: Motive

Structure: Impulse

Position: Wave (4) - orange

Details:
Wave (3) - orange has recently concluded, and wave (4) - orange is currently in progress, suggesting further downside movement. The sharp and bearish nature of wave (4) requires close monitoring until sufficient evidence of wave (5) - orange starting emerges.

Invalidation Point: 17.15

Coles-Group-Limited-...


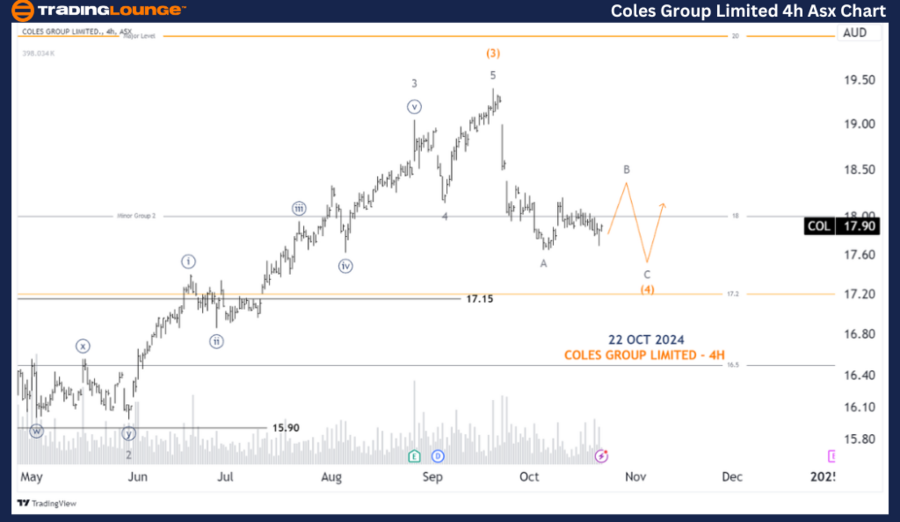
ASX: COLES GROUP LIMITED (COL) 4-Hour Chart Analysis

Function: Major trend (Intermediate degree, orange)

Mode: Motive

Structure: Impulse

Position: Wave B - grey of Wave (4) - orange

Details:
In the 4-hour chart, wave (4) - orange appears to unfold as a Zigzag pattern. Wave A - grey has already been completed, and wave B - grey is anticipated to move higher shortly. Following that, wave C - grey is expected to push lower, finalizing the fourth wave. The notable depth of wave four's retracement signals the importance of closely monitoring future developments.

Invalidation Point: 17.15

Technical Analyst: Hua (Shane) Cuong, CEWA-M (Master’s Designation).

Source: visit Tradinglounge.com and learn From the Experts Join TradingLounge Here 

See Previous: NEWMONT CORPORATION - NEM Elliott Wave Technical Analysis

VALUE Offer - Buy 1 Month & Get 3 Months!Click here

Access 7 Analysts Over 200 Markets Covered. Chat Room With Support

Coles-Group-Limited-...


Conclusion

Our technical analysis of ASX: COLES GROUP LIMITED (COL) provides insights into the ongoing market trends and potential trading opportunities. We highlight key price levels to validate or invalidate our wave counts, offering traders increased confidence in our outlook. This analysis aims to deliver a professional and objective perspective on the current market movements.

Related

COAL INDIA Elliott Wave Chart Analysis Highlights Corrective Wave B and Bearish Continuation into Wave C with Key Invalidation Level

COAL INDIA Elliott Wave Chart Analysis Highlights Corrective Wave B and Bearish Continuation into Wave C with Key Invalidation Level

Detailed COAL INDIA Elliott Wave analysis reveals a corrective phase in Wave B. Learn forecast, trad...

Read More >
NASDAQ 100 Elliott Wave Trend Analysis: AAPL, AMZN, NVDA, TSLA, GOOGL, META, NFLX, MSFT 2024 Forecast

NASDAQ 100 Elliott Wave Trend Analysis: AAPL, AMZN, NVDA, TSLA, GOOGL, META, NFLX, MSFT 2024 Forecast

Summary: This video provides an Elliott Wave analysis and trading strategies for stocks in the NASD...

Read More >
U.S.Dollar /Canadian Dollar(USD/CAD) Elliott Wave Technical Analysis 29 November 23

U.S.Dollar /Canadian Dollar(USD/CAD) Elliott Wave Technical Analysis 29 November 23

USD and CAD Elliott Wave Analysis Trading Lounge Day Chart dated 29 November 23, delves into a detai...

Read More >
ASX FPH Stock Analysis: Fisher & Paykel Healthcare Elliott Wave Forecast, Wave 4 Triangle Pattern, and Price Prediction Insights

ASX FPH Stock Analysis: Fisher & Paykel Healthcare Elliott Wave Forecast, Wave 4 Triangle Pattern, and Price Prediction Insights

Elliott Wave analysis for ASX: FPH (Fisher & Paykel Healthcare Corporation Limited). Our technical a...

Read More >
Explore our detailed U.S.Dollar/Japanese Yen(USDJPY) Forex Elliott Wave Technical Analysis

Explore our detailed U.S.Dollar/Japanese Yen(USDJPY) Forex Elliott Wave Technical Analysis

Explore our detailed USD/JPY Elliott Wave analysis, focusing on daily and 4-hour charts. Understand ...

Read More >
U.S. Dollar / Swiss Franc Forex Technical Analysis | USDCHF Elliott Wave Analysis: Day and 4-Hour Chart Forecast for Traders

U.S. Dollar / Swiss Franc Forex Technical Analysis | USDCHF Elliott Wave Analysis: Day and 4-Hour Chart Forecast for Traders

This post provides a comprehensive USDCHF Elliott Wave analysis, including insights from day and 4-h...

Read More >

Buy 1 Month

Get 3 Months!

Special Offer:

Trade Recommendations

Unleash the power of deversified trading with our comprehensive portfolio, covering:

  • Stock Trades
  • Crypto Trades
  • Forex Trades
  • Commodity Trades
Elliott Wave Analysis

Gain a competive edge with expert insights in to:

  • Global Indices
  • US Stocks & ASX Stocks
  • Forex & Crypto
  • Commodities
Top-Notch Trading Tools

Equip yourself with the tools of success:

  • Social Chat
  • Elliott Wave Algorithm
  • Screener
  • TradingLevels
  • Trading Game
7 Elliott Wave Analysts

Stay ahead of the market with daily charts and insightful videos
-Your secret to strategic trading!

JOIN HERE


Welcome to TradingLounge (ASIC A.R.No. 321187), specialists in trades, trading education and technical analysis, covering stocks, indices, commodities, forex and cryptocurrencies.

When you join TradingLounge you have access to everything we offer, including trade tools, educational content and a social platform to chat with like-minded investors.

Read more

@Copyright 2024 by tradinglounge.com

Contact Us

Australian no: 02 4787 6020

International no: +61 (2) 47876020

Pay with:

Find us on