Elliott Wave Technical Assessment of ETH/USD: A Deep Dive into Trends
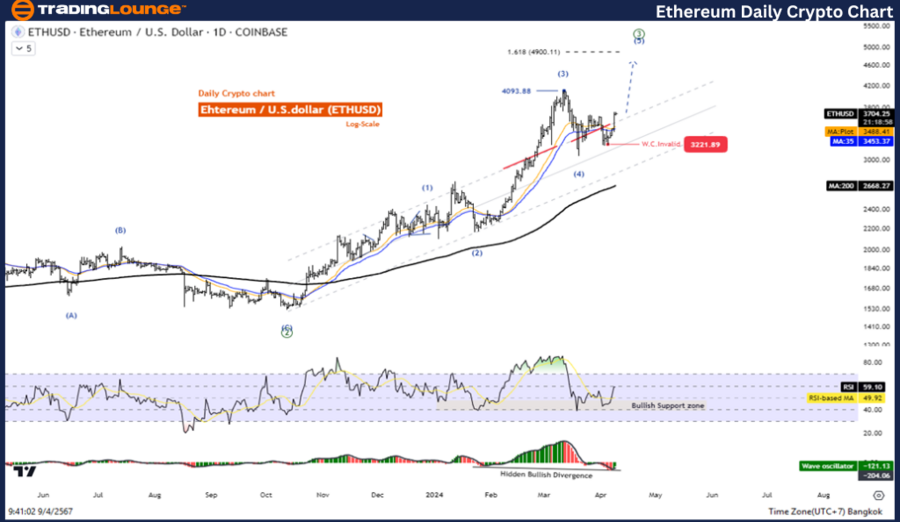
Ethereum/ U.S. dollar(ETHUSD) Day Analysis
ETHUSD Elliott Wave Technical Analysis
The Essence of the Current Trend
-
Functionality: Trend-Following
-
Behavioural Mode: Motive Phase
-
Pattern Structure: Impulse Formation
-
Current Positioning: At Wave 5
-
Future Projections: Aiming towards wave ((3)) of the next higher echelon
- Critical Threshold for Validity: Nullification level not specified
Insightful Details: The analysis suggests that Wave 4 might have reached its completion, setting the stage for a resurgence in price during Wave 5.
Strategic Approach to ETH/USD Trading:
Ethereum's trajectory is characterized by a consistent uptrend, propelled by an Impulsive wave pattern. Presently, the market is in a phase of recovery from the fourth wave correction, anticipating an ascent in the fifth wave. Traders should monitor for lucrative opportunities to capitalize on this fifth-wave surge.
ETH/USD Technical Indicators Analysis:
- The trading price positioning above the 200-day Moving Average (MA200) signals a robust uptrend.
- The Wave Oscillator's bullish momentum further corroborates the optimistic outlook.

Ethereum against U.S. Dollar: Elliott Wave Analysis on the 4-Hour Chart
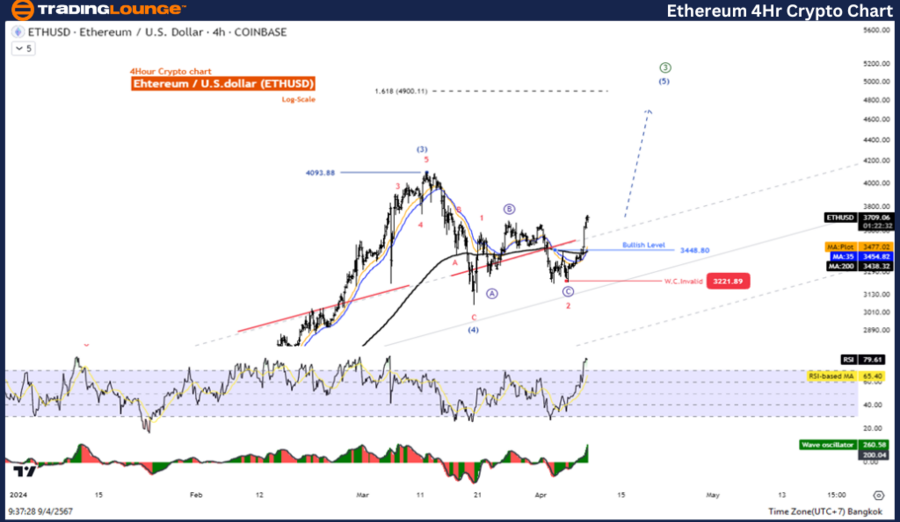
Ethereum/ U.S. dollar(ETHUSD) 4-Hour Chart Analysis
Elliott Wave Technical Analysis of ETHUSD
ETH/USD Elliott Wave Technical Overview
-
Functionality: Trend Adherence
-
Behavioural Mode: Motive Phase
-
Pattern Structure: Impulse Pattern
-
Current Positioning: At Wave 5
-
Anticipated Direction: Progressing towards wave ((3)) at a superior degree
- Critical Threshold for Validity: Not mentioned
In-depth Analysis: Similar to the daily chart's insights, the 4-hour chart analysis indicates that Wave 4 is potentially complete, and we can expect a price increase as we enter Wave 5.
ETH/USD Trading Strategy Insights:
Echoing the larger uptrend, Ethereum’s journey on the 4-hour chart exhibits a motive sequence, currently recovering from the fourth-wave dip. This recovery is the precursor to the anticipated rally in Wave 5, suggesting a strategic window for traders to engage with the upcoming uptrend.
Technical Indicators Review:
- A position above the MA200 is a clear indicator of an uptrend, affirming a bullish stance.
- The positive momentum signalled by the Wave Oscillator aligns with the forecasted upward movement.
Technical Analyst: Kittiampon Somboonsod
Source: visit Tradinglounge.com and learn From the Experts Join TradingLounge Here
See Previous: AAVE/ U.S. dollar(AAVEUSD)
TradingLounge Once Off SPECIAL DEAL: Here > 1 month Get 3 months.
TradingLounge's Free Week Extravaganza!
April 14 – 21: Unlock the Doors to Trading Excellence — Absolutely FREE

By incorporating these insights into your trading strategy, you can navigate the Ethereum market with a keen understanding of Elliott Wave principles. Keep a close eye on technical indicators and wave patterns to optimize your trading outcomes in the ETH/USD pairing.