Elliott Wave Analysis Overview for AAVE/USD
In the intricate world of cryptocurrency trading, understanding the dynamics of market movements is crucial. The Elliott Wave Theory offers a structured approach to decoding these patterns. Our analysis of AAVE against the U.S. dollar (AAVEUSD) presents a detailed insight into its current market phase, based on the Elliott Wave Technical Analysis.
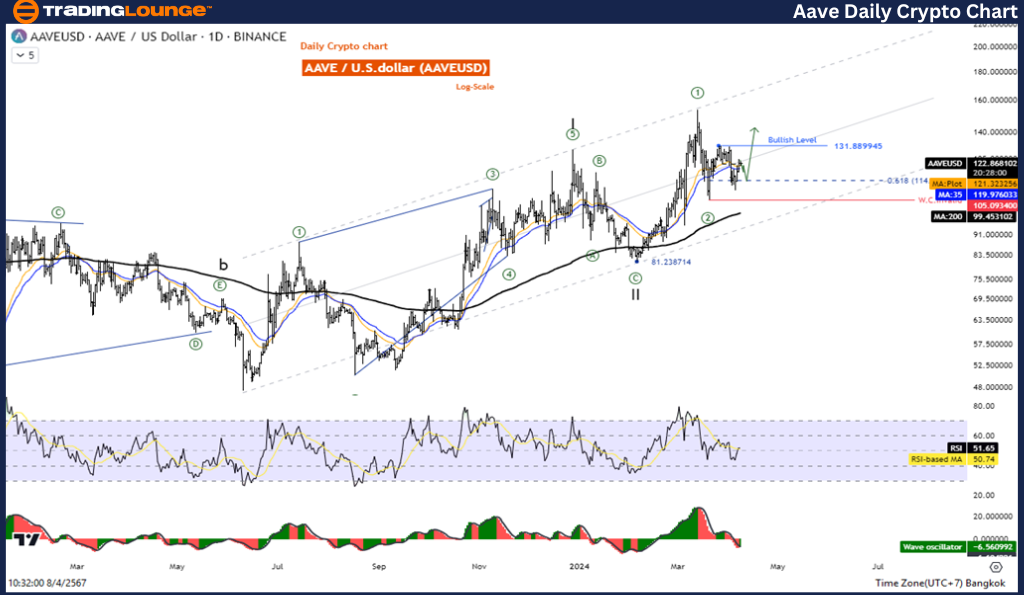
AAVE/ U.S. dollar(AAVEUSD) Day Chart Analysis
AAVEUSD Elliott Wave Technical Analysis
Technical Perspective: Deciphering the AAVE/USD Market Trends
- Functionality: Counter Trend
- Current Mode: Corrective Phase
- Structure Observed: Zigzag Pattern
- Current Position: Wave C
- Future Trajectory: Eyeing the Next Higher Degree – Wave ((2)) of an Impulse
- Invalidation Level: A critical threshold at 81.238
- Analysis Insight: There's a strong indication that Wave ((2)) has reached completion, paving the way for an upsurge in Wave ((3)).
Strategic Trading Approach for AAVE/USD
As we dissect the current trends of AAVE/USD, it's evident that the currency pair is on an upward trajectory, characterized by an Impulse pattern now embarking on its third wave. This phase signals a recovery from the previous second-wave correction, suggesting a bullish outlook for traders. Investors are encouraged to harness this upward momentum, as the currency pair is likely to experience a significant increase during the third wave.
Leveraging Technical Indicators for AAVE/USD
To bolster our analysis, we rely on pivotal technical indicators:
- The currency pair's position above the MA200 underscores a strong uptrend, affirming its bullish momentum.
- The Wave Oscillator further reinforces this sentiment, showcasing bullish momentum within the market.

AAVE/USD Elliott Wave Analysis on the 4H Chart
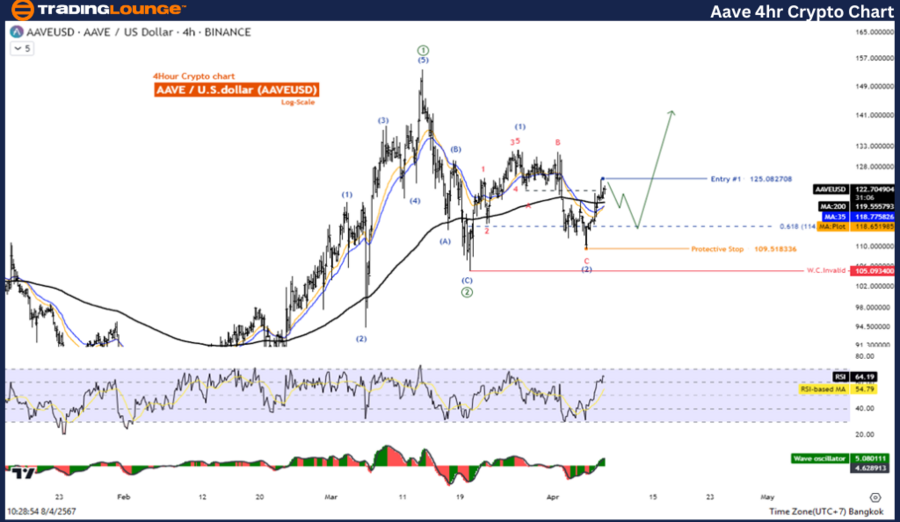
AAVE/ U.S. dollar(AAVEUSD) 4H Chart Analysis
AAVEUSD Elliott Wave Technical Analysis
Reiterating the findings from our daily chart analysis, the 4-hour chart echoes similar patterns and projections for AAVE/USD:
-
Function: Counter Trend
-
Current Mode: Corrective
-
Observed Structure: Zigzag
-
Position: Wave C
-
Projected Direction: Aiming for Wave ((2)) of an Impulse
-
Cancellation Threshold: Watch for 81.238 as the invalid level
- Insight: The completion of Wave ((2)) is likely, setting the stage for an uptrend in Wave ((3)).
Strategic Implications for Traders
Our comprehensive analysis underlines AAVE/USD's robust uptrend, with the currency pair currently rebounding from its second-wave correction. This pattern anticipates a significant upswing during its third wave, presenting a prime bullish trading opportunity for investors.
Key Technical Indicators Supporting AAVE/USD's Uptrend
- The MA200 indicator validates the currency pair's upward trajectory, signalling sustained bullish momentum.
- The bullish momentum is further confirmed by the Wave Oscillator, enhancing the trading strategy's robustness.
Concluding Insights: Navigating AAVE/USD's Future with Elliott Wave Analysis
Our Elliott Wave Analysis of AAVE against the U.S. dollar offers a strategic lens through which traders can navigate the market's complexities. By understanding the nuances of wave patterns, investors can make informed decisions, leveraging the bullish momentum predicted in the currency pair's journey. With technical indicators like the MA200 and Wave Oscillator reinforcing the uptrend, AAVE/USD presents a compelling case for bullish trading strategies.
Technical Analyst: Kittiampon Somboonsod
Source: visit Tradinglounge.com and learn From the Experts Join TradingLounge Here
See Previous: Bitcoin/ U.S. dollar(BTCUSD)
TradingLounge Once Off SPECIAL DEAL: Here > 1 month Get 3 months.
TradingLounge's Free Week Extravaganza!
April 14 – 21: Unlock the Doors to Trading Excellence — Absolutely FREE

In conclusion, the Elliott Wave Analysis presents an invaluable tool for traders aiming to capitalize on AAVE/USD's market dynamics. As we anticipate the unfolding of Wave ((3)), aligning trading strategies with the insights provided can significantly enhance market positioning and profitability.