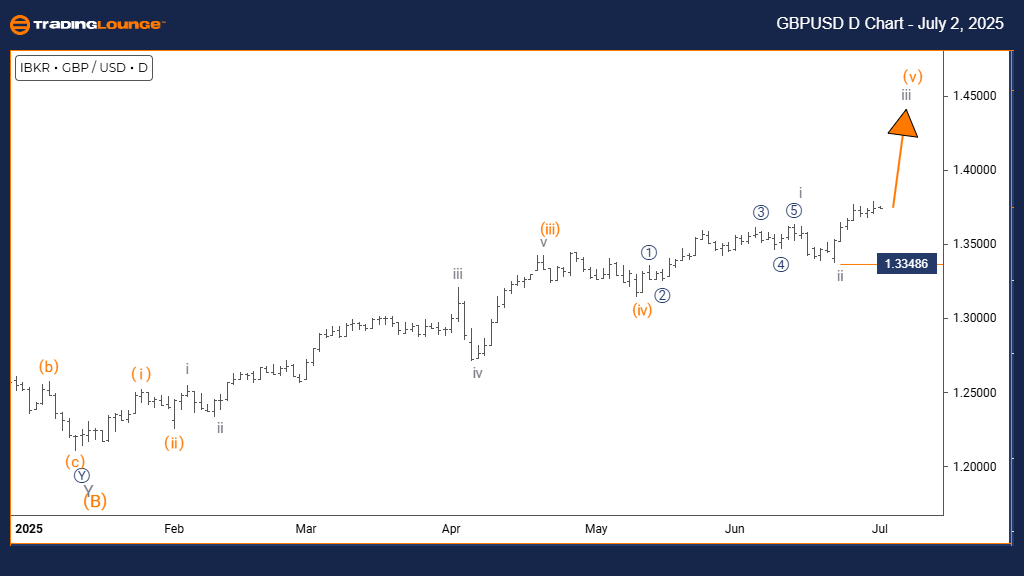
GBPUSD – Elliott Wave Analysis – Trading Lounge (Day Chart)
GBPUSD Elliott Wave Technical Overview
FUNCTION: Bullish Trend
MODE: Impulsive
STRUCTURE: Gray Wave 3
POSITION: Orange Wave 5
NEXT HIGHER DEGREE DIRECTION: Gray Wave 3 (Active)
DETAILS: Gray Wave 2 likely finished; Gray Wave 3 now developing.
Wave Cancel Invalidation Level: 1.33486
The Elliott Wave daily chart analysis for GBPUSD indicates a clear bullish trend. The pair is progressing within an impulsive wave structure, emphasizing strong upward price action. The current wave formation identifies Gray Wave 3 inside Orange Wave 5, a zone typically associated with accelerated bullish momentum.
Gray Wave 2 has likely concluded its corrective behavior, enabling Gray Wave 3 to unfold. This part of the wave cycle is historically linked to steep upward trends and fewer corrections. As it evolves within the broader Orange Wave 5, traders may anticipate continued gains and minimal retracements.
The key technical level remains 1.33486. A drop below this point would invalidate the current wave structure and require a reassessment. So long as GBPUSD trades above this invalidation level, the bullish Elliott Wave setup stays intact.
Supporting indicators suggest institutional buying pressure, reinforcing the view that the ongoing wave could lead to notable upward price development in alignment with the prevailing trend.
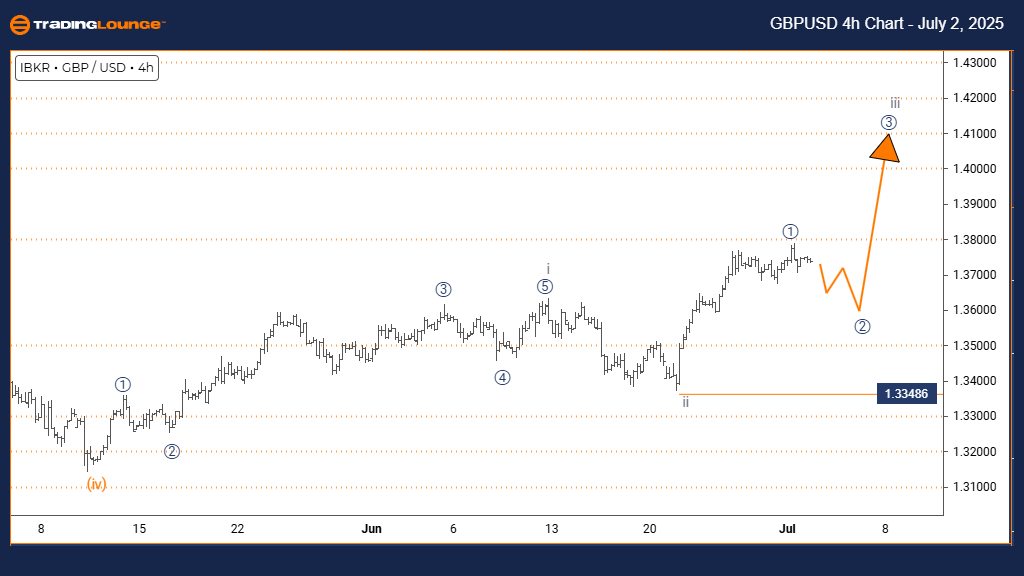
GBPUSD – Elliott Wave Analysis – Trading Lounge (4-Hour Chart)
GBPUSD Elliott Wave Technical Overview
FUNCTION: Counter Trend
MODE: Corrective
STRUCTURE: Micro Navy Blue Wave 2
POSITION: Gray Wave 3
NEXT HIGHER DEGREE DIRECTION: Micro Navy Blue Wave 3
DETAILS: Micro Navy Blue Wave 1 likely completed; Micro Navy Blue Wave 2 in progress.
Wave Cancel Invalidation Level: 1.33486
On the 4-hour timeframe, GBPUSD is currently experiencing a counter-trend correction within a larger bullish context. The price action is forming Micro Navy Blue Wave 2, a pullback occurring within the scope of Gray Wave 3, indicating a brief corrective phase.
The completion of Micro Navy Blue Wave 1 suggests the current decline is corrective in nature. As Wave 2 develops, the market may retrace part of the prior gains. Following its conclusion, Micro Navy Blue Wave 3 is expected to emerge, aligning with the broader upward trajectory.
This corrective structure often results in sideways price action or shallow declines in the short term. However, the position within Gray Wave 3 indicates that once this correction ends, bullish continuation is probable.
Traders should closely monitor for confirmation that Micro Navy Blue Wave 2 is ending. Its completion would likely mark the start of Micro Navy Blue Wave 3, potentially resuming the uptrend and offering new long opportunities.
Technical Analyst: Malik Awais
Source: Visit Tradinglounge.com and learn from the Experts. Join TradingLounge Here
Previous: AUDJPY Elliott Wave Technical Analysis
VALUE Offer - Buy 1 Month & Get 3 Months!Click here
Access 7 Analysts Over 200 Markets Covered. Chat Room With Support